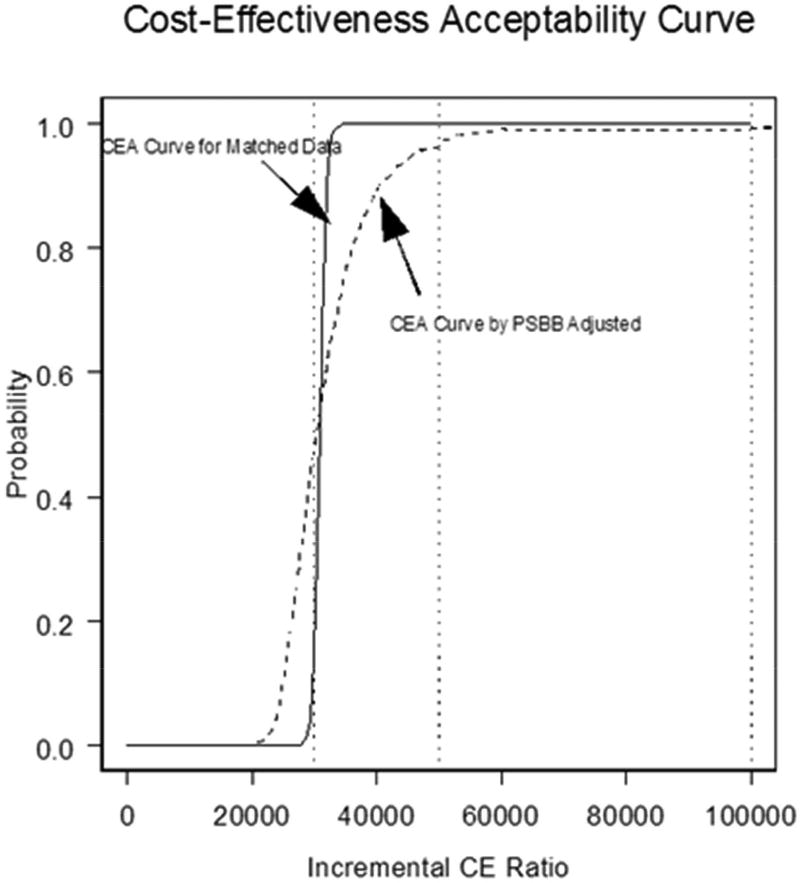
FIGURE 2. Cost-effectiveness Acceptability Curve.
The cost-effectiveness acceptability (CEA) curve for CABG compared to PCI demonstrates that for the lifetime analysis, the matched analytic population curve rises more steeply than that for PSBB adjusted initially, but the two converge over a lifetime. The y axis corresponds to the probability of observations below corresponding incremental cost-effectiveness (CE) ratio. PCI = percutaneous coronary intervention; other abbreviations as in Figure 2 and Central Illustration.

