. 2017 Nov 21;6:e28123. doi: 10.7554/eLife.28123

Figure 2. Overwintering locations and migratory distance of migrant European blackbirds (Turdus merula) between 2009 and 2014.

Figure 2.

(A) Mean overwintering locations (red symbols) and 25% kernel utilization distribution (red lines) of 22 blackbirds were calculated using the light-level data acquired by geolocators during the wintering months (November – February). Raw light level data were processed using the R package ‘GeoLight’(Lisovski and Hahn, 2012) and Kernel utilization distributions were calculated to estimate the error of each location. Filled red circles represent 16 individuals with one single measurement. The other symbols represent six individuals with at least two repeated measurements in different years. (B) Histogram of the migratory distance of migrants. (C) Female radio-tagged blackbird.

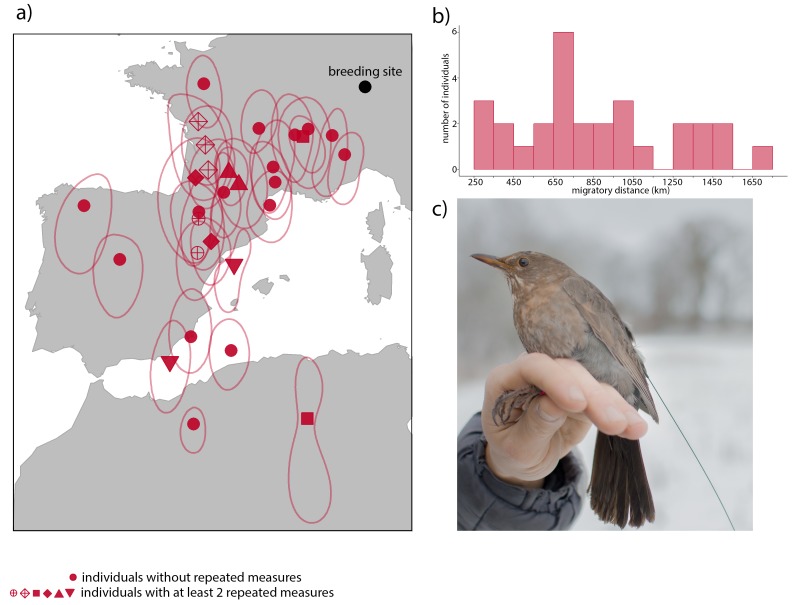
Figure 2—source data 1. Zip file contains five files: ‘locations_data.csv’; ‘kud2009.
Rdata’; ‘kud2010.Rdata’; ‘kud2011.Rdata’; ‘kud2012.Rdata’; ‘kud2013.Rdata’. ‘locations_data.csv’ contains the mean overwintering estimated locations (lat, long) of 22 blackbirds derived from Geolocators during the years 2009–2014 and plotted in Figure 2 panel a (red symbols). Estimated locations were calculated using the ‘geolight’ function from the Geolight R package. Files: ‘kud2009.Rdata’; ‘kud2010.Rdata’; ‘kud2011.Rdata’; ‘kud2012.Rdata’; ‘kud2013.Rdata’: 25% kernel utilization distribution representing the error of each estimated overwintering locations for the different years in R data format and plotted in Figure 2 panel a (red circles).
DOI: 10.7554/eLife.28123.005
Figure 2—source data 2. Lat and long and distance to the breeding grounds (km) to the 29 overwintering locations of European blackbirds (2009–2014) used to generate histogram of Figure 2 panel b.
DOI: 10.7554/eLife.28123.006