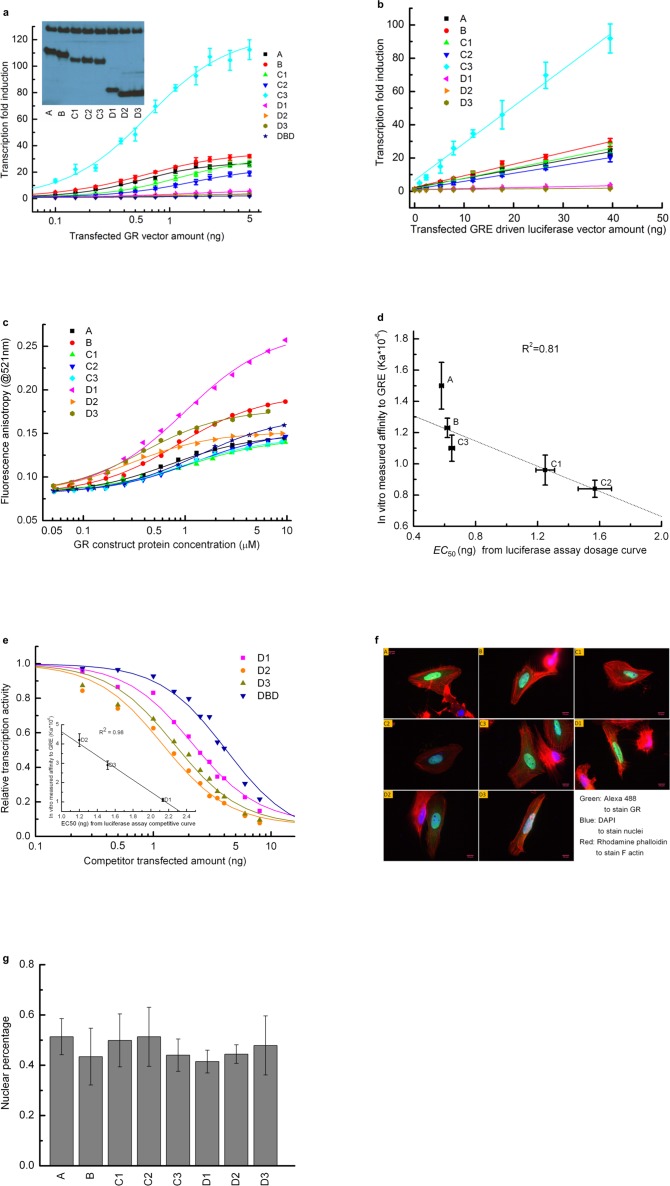
(a) Luciferase assay dosage curves for the constitutively active constructs of the eight GR translational isoforms. Per 30,000 cells, a constant 40 ng of GRE-driven luciferase vector was transfected, and the amount of GR vector co-transfected was increased from 0 ng to 5 ng. Errors are calculated from three samples. Curves are fitted to the data using the dose-response function, . Amax represents the maximum transcriptional activity for each construct, and EC50 represents the amount of GR construct transfected at the half-maximum transcriptional activity. C is the amount of GR construct transfected at each data point. p is an empirical value introduced in the fitting equation, to transform DNA vector amount to protein expression amount, to account for the possibility that different isoforms have different degradation rates, expression levels, nuclear localizations and/or cooperativities. Inset: Western blot showing that U-2 OS cells transiently transfected with the expression plasmid for each isoform express each of them. (b) Luciferase assay dosage curve keeping each GR isoform vector constant at 4 ng per 30,000 cells, while gradually increasing the GRE-driven luciferase vector from 0 ng to 40 ng. Data were fitted by a linear function. (This indicates that 5 ng GR isoform construct can saturate the 40 ng GRE driven luciferase vector.) Errors are the standard deviations of three independent samples. (c) Fluorescence anisotropy of the 6-FAM-labeled half site GRE (5’-gcgcAGAACAggagcgc-3’) as a function of GR translational isoform concentration. Binding was conducted with 25 nM 6-FAM labeled GRE in buffer containing 10 mM HEPES (pH7.6), 80 mM NaCl, 1 mM EDTA, 5 mM MgCl2, 1 mM DTT, 10% glycerol, 200 ug/mL BSA and 5 µM control non-specific 17-mer oligo. Curves represent fits to the data with a single-site-binding model. (d) Correlation between the EC50 fitted from the in vivo dosage curve as shown in panel a and the in vitro binding affinity as shown in panel c, demonstrating that the in vitro binding affinity represents the in vivo binding. Error bars represent uncertainty of the fits, as returned by the default settings of Mathematica’s NonLinearModelFit function. (e) Competitive transfection assay comparing D1, D2, D3 and DBD, against titration of a constant amount of C3 isoform (which has the highest activity). The transcription activity of C3 isoform in absence of competitors was normalized to 1. Data were fitted with dose-response function, . In this equation, Acompetitor represents the transcriptional activity when 16 ng of competitor is transfected alone, EC50 represents the co-transfected amount of competitor construct that results in half the activity of the C3 maximum. C is the amount of competitor construct transfected at each data point. p is an empirical value described in panel a. Inset: correlation between the EC50 fitted from the competitive binding assay and the in vitro measured binding affinity for D1, D2 and D3 isoforms (as obtained from panel c). Errors reflect uncertainties of the individual fits, as returned by the default settings of Mathematica’s NonLinearModelFit function. The correlation demonstrates that the competitive transfection assay provides qualitative information about the binding affinity of each inactive construct. (f). Multicolor immunostaining of U-2 OS cells transfected with A, B, C1, C2, C3, D1, D2 and D3 constructs. Green: Alexa 488 linked goat anti-mouse IgG staining GR. Blue: DAPI staining nuclei. Red: Rhodamine Phalloidin staining F-actin. (g) Nuclear localization efficiency for the eight GR translational isoforms. Nuclear percentage is calculated by dividing the intensity of the green dye overlapped with blue dye with the total green dye intensity as shown in panel f. Three pictures were used for each isoform for the quantification. Average values and standard errors of the mean are reported in the graph.


