Two independent methods were used to estimate parameters for the EAM from experimental data. The first method was a ‘brute force’ grid search for parameter combinations that satisfied the experimental transcriptional activity and binding affinity data, and the second method used unbiased global minimization of a chi-squared merit function against the experimental transcriptional activity and binding affinity data, as implemented in the attached
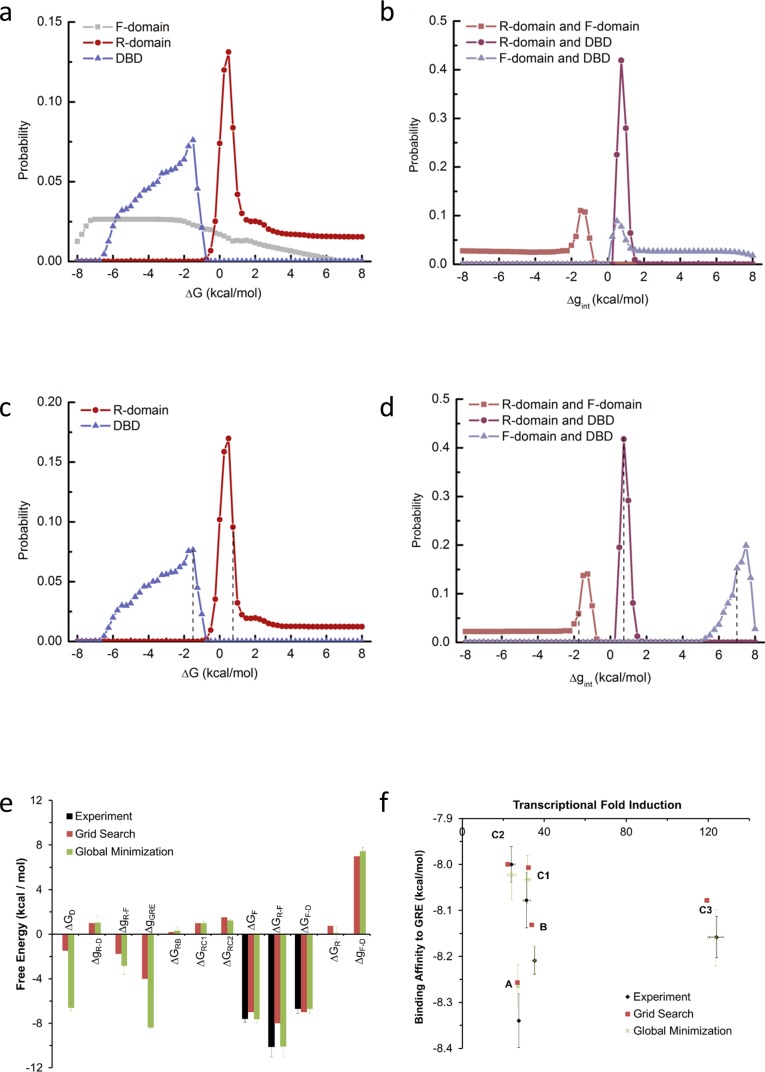
Mathematica notebook. Panels a-d are relevant to the first method, and panels e-f demonstrate that the resulting estimates from both methods were robustly similar in sign and magnitude. The first method was exhaustive subject to the following reasonable parameter space constraints (the second method was subject to no constraints): (1) full length isoform A has higher binding affinity and lower transcriptional activity than C3 isoform (as experimentally demonstrated in
Figure 1 and
Figure 1—figure supplement 1a–d); (2) The probability of the high-affinity state of A isoform is less than 40%, as A isoform’s binding affinity is more than 2.5 fold lower than D2 isoform, which has highest binding affinity among all the translational isoforms (as experimentally demonstrated in
Figure 1 and
Figure 1—figure supplement 1c–d); (3) R
A-linker-DBD construct has higher binding affinity than linker-DBD construct (as experimentally demonstrated in
Figure 3b); (4) In presence of GR response element, the sum of probability of the functional states (with F-domain in the folded conformation and the DBD in the high-affinity state) is larger than 5%, which is consistent with the possibility of a large population increase upon a small energetic stabilization, such as a binding event to co-regulators. During the parameter space search, each stability term was explored from −8 kcal/mol to +8 kcal/mol, with a step size of 0.25 kcal/mol, thus the search was exhaustive within a resolution of that increment. (
a) Probability distribution plot of the stability of the F-domain, the R-domain and the DBD (with the folded conformation or high-affinity state as reference). (
b) Probability distribution plot of the interaction energy between the R-domain and the F-domain, the R-domain and the DBD and the F-domain and the DBD. As shown in panel a, the distribution of the F-domain stability has high uniform probability between −7.5 kcal/mol and −2 kcal/mol, consistent with its experimental stability of −7.6 ± 0.3 kcal/mol measured by in vitro TMAO folding (
Figure 2a and
Figure 2—figure supplement 1a). Thus, to save computational time, the parameter space search was carried out again by fixing F-domain stability at −7 kcal/mol and exhaustively scanning the other parameters. Under such conditions, the probability distribution of the stabilities of the R-domain and the DBD are shown in panel
c and the distributions of the interaction energies between domains are shown in panel
d. A range of parameter combinations can satisfy the experimental constraints, but it is important to emphasize that with no parameter does the sign of the energy change. With any such set of parameter combinations, the simulated transcriptional activity and the simulated binding affinity of C3 isoform can be calculated as relative to A isoform. Calculating the RMSD between these simulated values and experimental data was employed as a useful heuristic to assess which sets of the parameter combinations best simulated the experimental observations. Another useful heuristic, a ‘distribution score’, was employed to assess how well a chosen parameter compared to the mode of its distribution. One arbitrarily chosen set of parameters exhibiting reasonable compromise between a minimum RMSD and a maximum ‘distribution score’ was the following: (
=−1.0 kcal/mol,
= 0.75 kcal/mol,
= −7 kcal/mol,
= 0.75 kcal/mol,
= −1.75 kcal/mol, and
= 7.0 kcal/mol (positions of these values were labeled with dashed lines in panels c and d). This set was used to calculate the simulated transcriptional activity and binding affinity from EAM as shown in
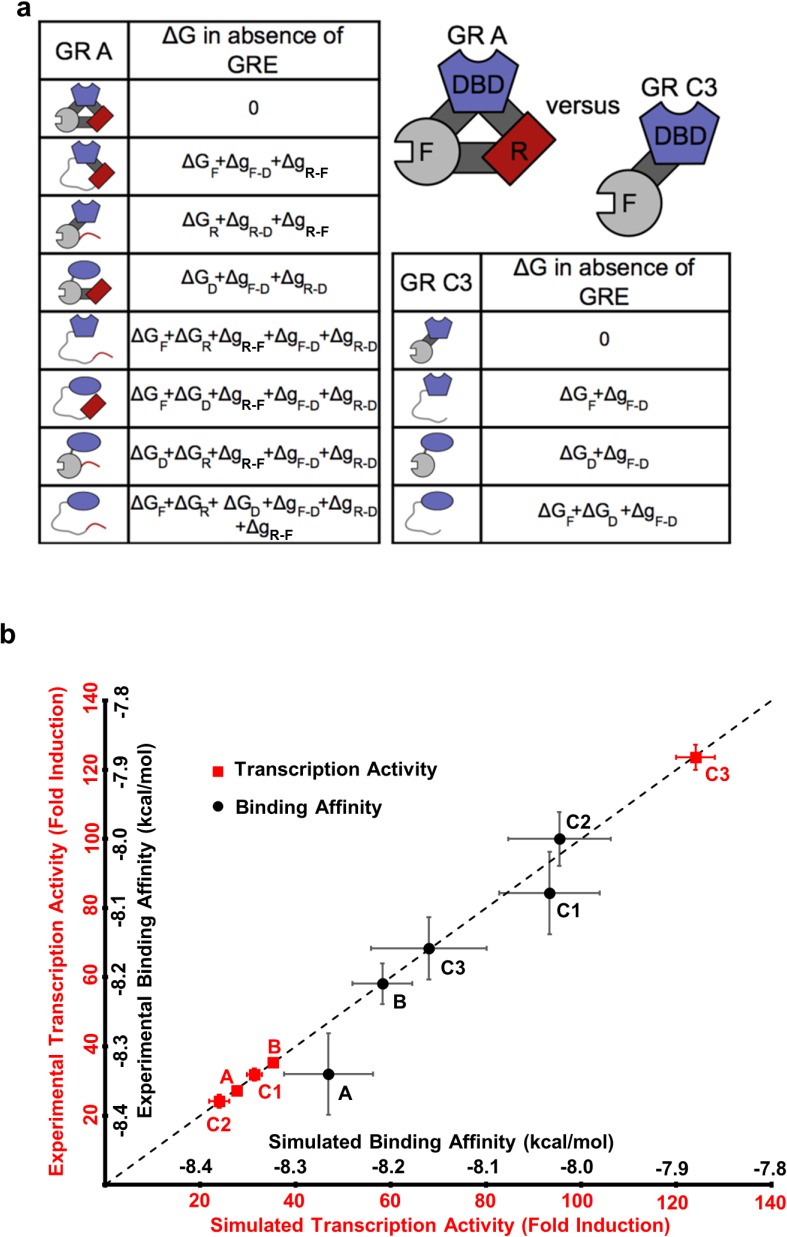
Figure 5b,
Figure 6b and e, and
Figure 6—figure supplement 1g–i. (
e) Domain stabilities and interaction energies estimated by the two methods are similar in sign and magnitude. To demonstrate robustness of the global minimization, experimental errors from the stability measurements were propagated through the model. Error bars represent the standard deviations of 10 independent minimizations. (
f) Parameter estimates from both methods were used with the EAM to compute expected transcriptional activity and binding affinity. Reasonable agreements with experiment data were obtained from both methods.


