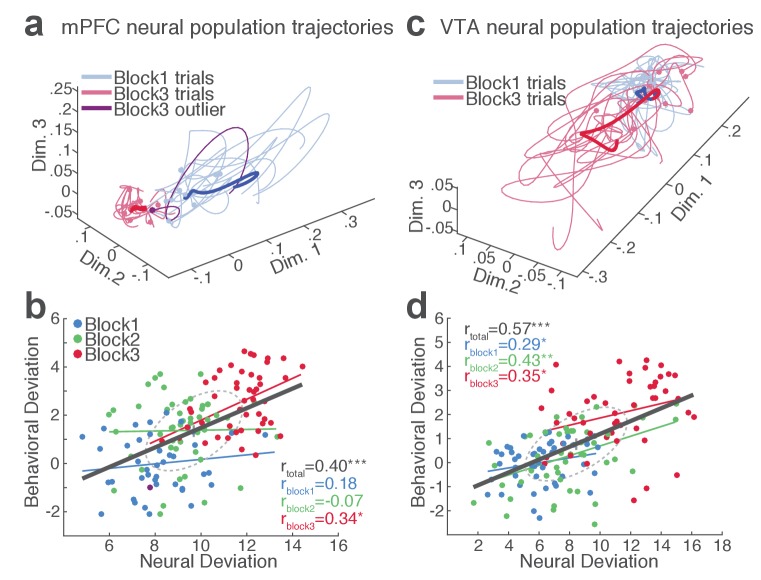
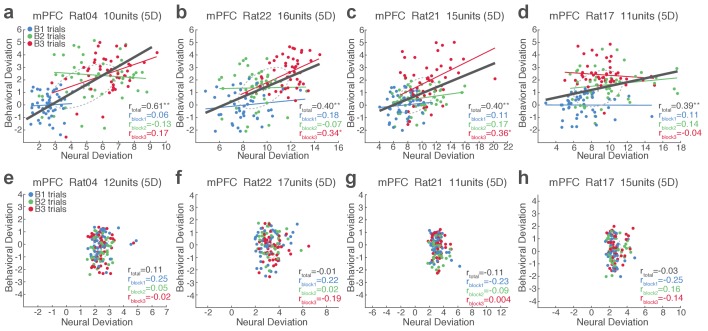
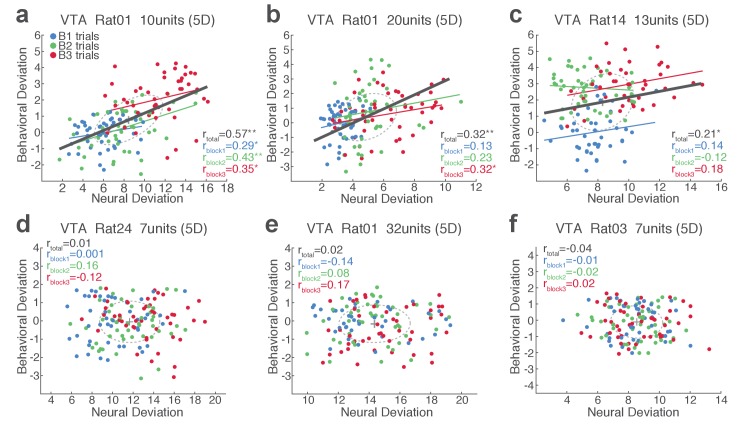
Figure 6. mPFC and VTA neuronal populations track the trial-to-trial variability in RT.
(a) Trial-by-trial trajectories of an mPFC neuronal population (16 units) activity were extracted using the GPFA (Materials and methods). Trajectories of trials in block 1 and 3 are visualized in a population state space comprising the top three ortho-normalized dimensions. For simplicity, ten trials were randomly selected per block. The dimensionality of state space was determined to be five for all populations, based on the cross-validated data likelihood (Materials and methods). Each trajectory corresponds to −0.5 to 0.5 s peri-action epoch (action occurring at time = 0). Filled circles indicate initial points of neural trajectories. Heavy lines indicate the mean trajectory averaged across all trials in each block. The purple-colored block 3 neural trajectory represents a single trial with an outlying RT similar to a block 1 trial. (b) A scatter plot indicating behavioral deviation from the block 1 mean RT and neural deviation from the block 1 mean trajectory of the mPFC population shown in (a). RT was log transformed for proper scaling. Superimposed color-coded lines indicate regression slopes per block. The dark gray line indicates the regression slope for total trials pooled across blocks. The behavioral and neural correlation coefficients calculated on total trials and trials per block are indicated. *p<0.05, **p<0.005. (c) Neural population trajectories of a representative VTA population comprising 10 units. (d) A scatter plot indicating behavioral deviation from the block 1 mean RT vs neural deviation from the block 1 mean trajectory of the VTA population shown in (c).


