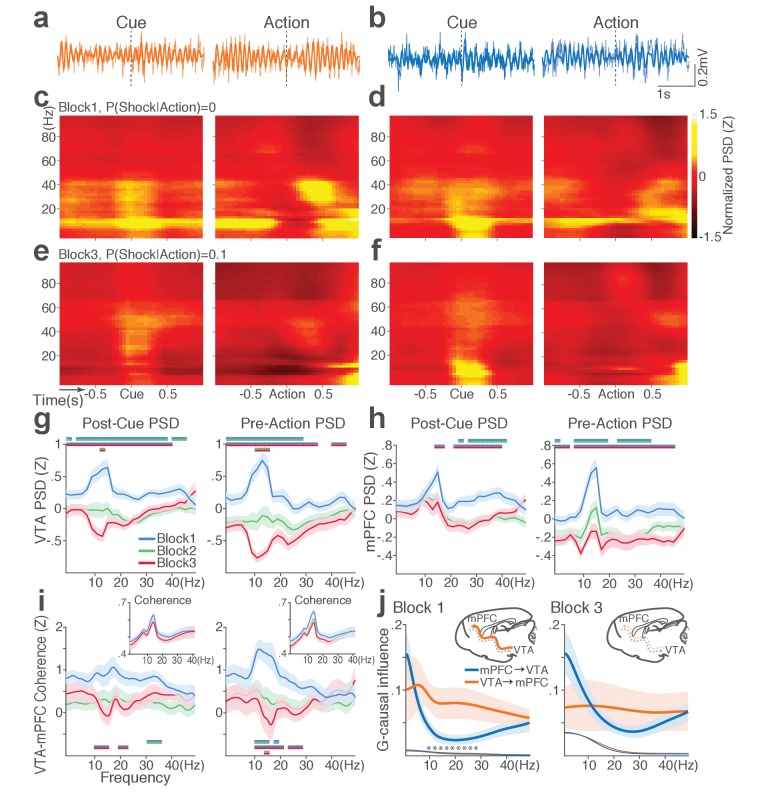
Figure 7. Punishment diminishes theta oscillation-mediated neural synchrony in the VTA-mPFC circuit.
(a) Representative VTA peri-event LFP traces in a block 1 trial. Bandpass filtered LFP signal (heavy line) is superimposed on the raw trace (thin line). (b) Simultaneously recorded mPFC LFP traces. (c) Baseline-normalized VTA power spectrograms averaged across block 1 trials (left: peri-cue, right: pre-action). mPFC block 1 power spectrograms are in (d). (e) Diminished VTA theta power in block 3. (f) Similar diminishment observed in mPFC theta power. (g) Mean ±s.e.m. (shaded area) normalized VTA PSDs per block corresponding to 1 s post-cue (left) and pre-action (right) epochs. Dual-colored bars indicate significant pairwise differences at corresponding frequency bins according to post hoc analyses (p<0.05). (h) Normalized mPFC PSDs in post-cue (left) and pre-action (right) epochs. (i) Normalized VTA-mPFC LFP coherence in post-cue (left) and pre-action (right) epochs. Insets represent non-normalized LFP coherences of each block. (j) Granger-causality, representing mutual influences (directionality) between VTA and mPFC peri-action LFP time series in block 1 (left) and block 3 (right). Blue and orange curves represent mPFC-to-VTA and VTA-to-mPFC Granger-causal influences, respectively. Shaded areas indicate s.e.m. Thin colored-lines below indicate upper bounds of confidence intervals (α = 0.001) acquired by the random permutation resampling of time bins. Asterisk indicates significant difference between bidirectional Granger-causal influences at the corresponding frequency bin (p<0.05).


