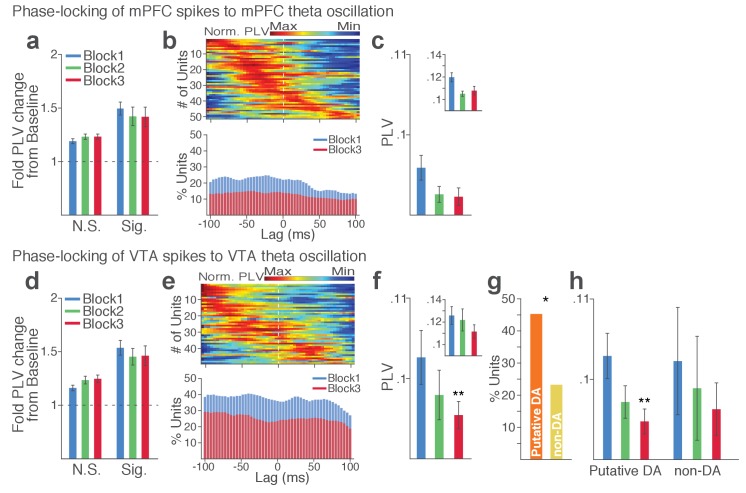
Figure 8. Punishment risk reduces VTA and mPFC neuronal synchrony to local theta oscillation.
(a-c) Modulation of mPFC neuronal synchrony to mPFC theta oscillation. Phase-locking values (PLVs) were quantified by averaging 1000 mean resultant lengths (MRLs) of the circular phase angle distribution comprising 100 resampled spikes per iteration (Materials and methods). (a) Fold change from baseline in the strength of the neuronal phase-locking during peri-action epoch in units that passed Rayleigh z-test (Sig.) and rest of the units (N.S.). (b) Top, Normalized PLVs in block 1 across a range of time lags for all phase-locked mPFC units, aligned by peak lags. Bottom, Percentage of significantly phase-locked mPFC units in block 1 vs 3 across a range of lags. (c) Mean ±s.e.m. PLVs across different blocks. Inset, PLVs including significantly phase-locked units only. (d-h) Modulation of VTA neuronal synchrony to VTA theta oscillation. (d) Fold change from baseline in the strength of the neuronal phase-locking. (e) Top, Normalized PLVs in block 1 of all phase-locked VTA units. Bottom, Percentage of significantly phase-locked VTA units. (f) Mean ±s.e.m. PLVs across different blocks. (g) Percentage of phase-locked VTA putative DA and non-DA units. (h) PLVs of VTA putative DA and non-DA units plotted separately.

