Figure 4.
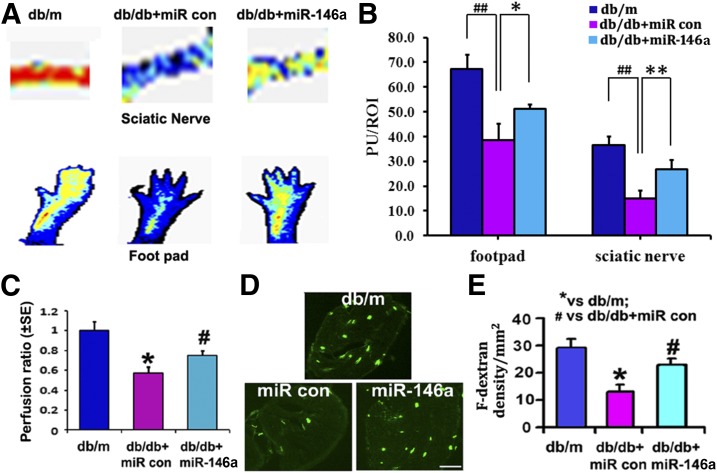
miR-146a treatment improves neurovascular function. A shows representative images of regional blood flow in footpad and sciatic nerve tissues 8 weeks after miR-146a mimic treatment. B shows the quantitative analysis of blood flow based on laser Doppler perfusion imaging. Diabetic miR-146a injection markedly increased perfusion of sciatic nerve and footpad in diabetic mice. Lowest blood flow is indicated in blue, maximum blood flow in red, and intermediate grading in green and yellow. C shows the perfusion ratio of blood flow normalized with db/m mice in sciatic nerves. Images of FITC-dextran (F-dextran) perfused vessels (D) and the quantitative data of perfused vascular area (E), respectively, in db/m mice and db/db mice treated with miR-146a mimics (10 mg/kg, db/db + miR-146a) or cel–miR-67 mimics (db/db + miR control [con]). n = 4/group in C. n = 10 for db/m group; n = 13 for db/db + miR con and db/db + miR-146a groups in A, D, and E. Scale bar = 100 μm. *P < 0.05 and **P < 0.01 vs. nondiabetic (db/m) mice; #P < 0.05 and ##P < 0.01 vs. db/db mice treated with cel–miR-67 mimics (db/db + miR con). PU, perfusion units; ROI, region of interest.

