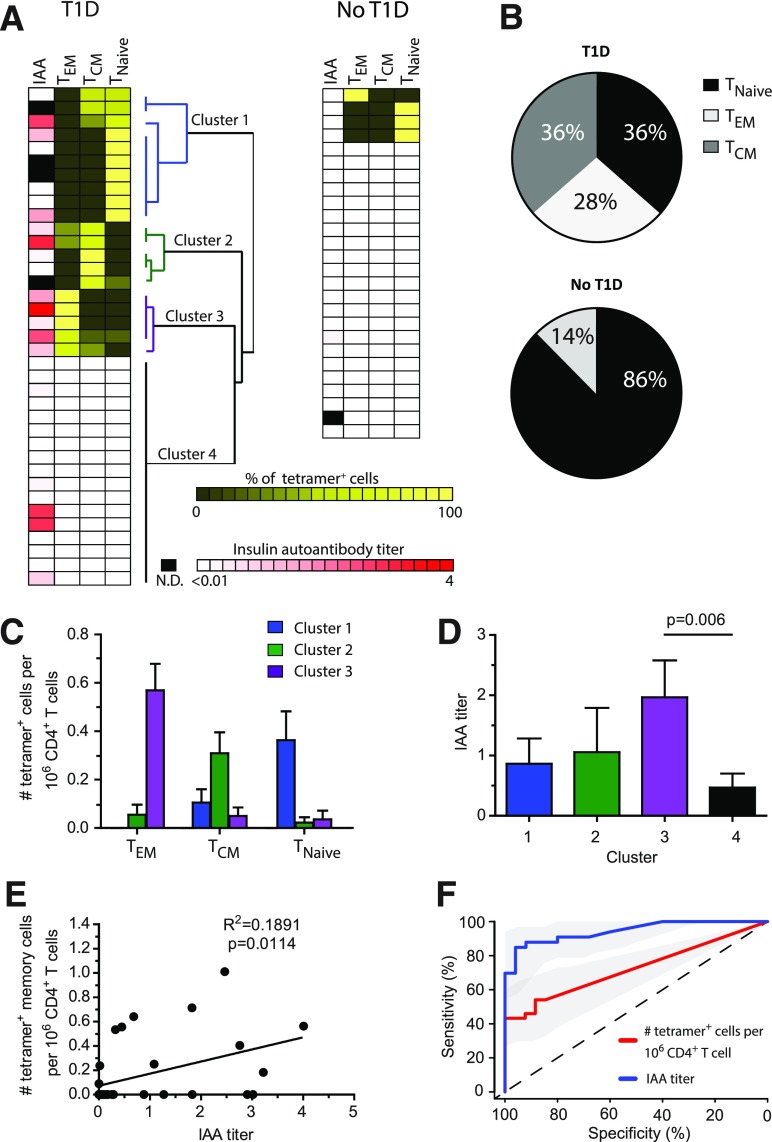
Figure 3.
Phenotype and correlation analysis of InsB-tetramer+ cells with insulin antibody. A: IAA titer along with unbiased hierarchical clustering analysis based on tetramer+ cell frequency and phenotype. Each row represents an individual patient (n = 37) or sample from a control subject without diabetes (n = 26), biological replicates. N.D., not determined. B: Combined phenotype of all tetramer+ cells from all patients shown in panel A. C: Frequency of insulin-tetramer+ cells within TEM, TCM, and TNaïve phenotypes from patients within each cluster as determined in panel A. D: Plasma IAA titer among patients within each cluster as defined in panel A. E: Correlation of the frequency of tetramer+ memory (TEM and TCM) cells identified in each patient with their IAA titer. F: Receiver operating characteristic curve analysis using R 3.2.4 software to measure the sensitivity, specificity, and overall performance of tetramer+ cell frequency or IAA to identify individuals with T1D. Bars represent the mean ± SEM. A one-way ANOVA test (D) or linear regression (E) was used to determine significance.

