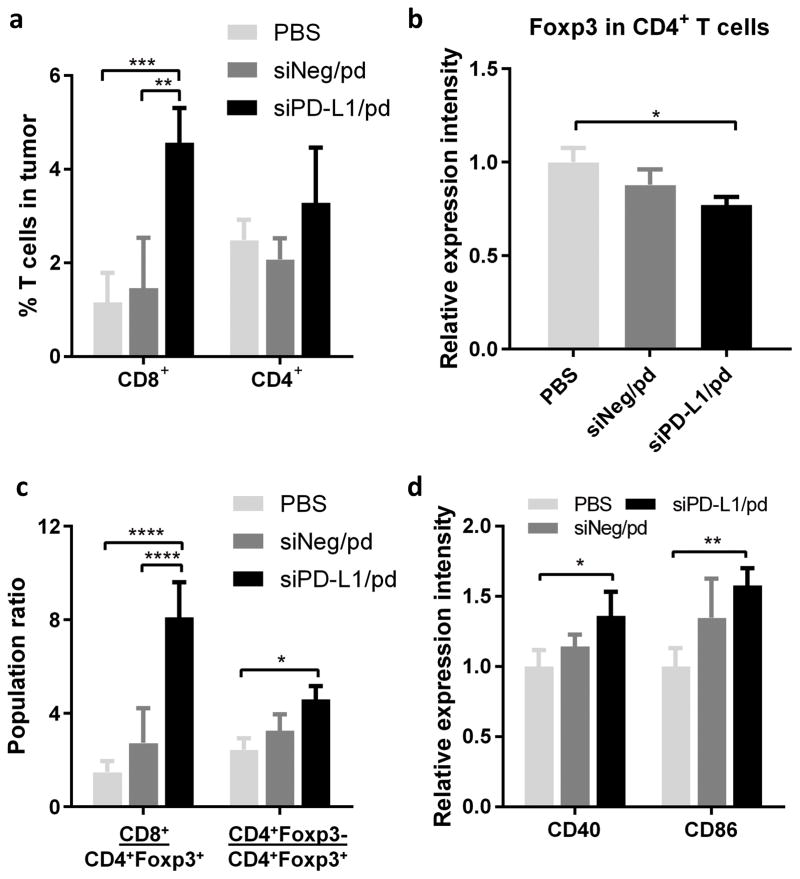
Figure 8.
(a) % CD8+ and CD4+ T cells in B16F10-OVA tumors of C57BL/6 mice receiving different treatments (also see Figure S6 and 7). (b) Relative intensity of Foxp3 expression on CD4+ T cells in B16F10-OVA tumors (also see Figure S7). (c) Ratios of CD8+ T cells to CD4+Foxp3+ T cells and CD4+Foxp3− T cells to CD4+Foxp3+ T cells in B16F10-OVA tumors. (d) Relative expression intensity of DC maturation markers (CD40, CD86) on DCs in DLNs of C57BL/6 mice with B16F10-OVA tumors receiving different treatments (also see Figure S8). n =3 mice per group, mean ± s.d. *: p<0.05; **: p < 0.01; ***: p < 0.001; ****: p < 0.0001 by Tukey’s multiple comparisons test.

