
Figure 6.
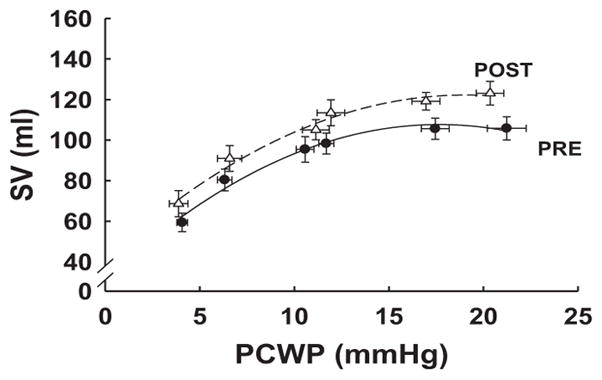
Starling curves representing pulmonary capillary wedge pressure (PCWP) as an index of left ventricular end-diastolic pressure vs stroke volume (SV) over range of left ventricular filling produced by lower body negative pressure (2 lowest values of PCWP), quiet baseline (2 middle values of PCWP), and rapid saline infusion (2 highest values of PCWP), as described in the text (before vs after, P<0.0001). Each data point represents the mean±SE of all subjects before (filled symbol) and after (open symbol) 1 year of training.