
Figure 5.
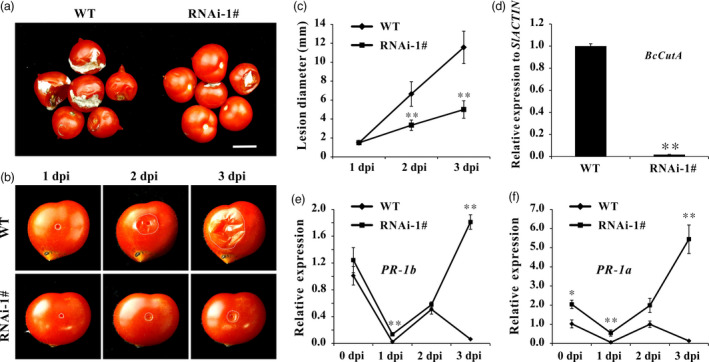
Suppression of SlPL in tomato decreased pathogen susceptibility. (a) Symptoms of intact WT and SlPL ‐RNAi fruit after spraying of spores of B. cinerea (B05.10). Compared to rapid softening and collapsing symptoms in WT, fruit of the SlPL silenced line showed little mycelium at 5 days postinoculation (dpi). The scale bar represents 1 cm. (b) Symptoms of wounded WT and SlPL ‐RNAi fruit after inoculation with B. cinerea (B05.10) at 1, 2 and 3 dpi. White dots represent the lesion margins. (c) Lesion diameter was measured at 1, 2 and 3 dpi. Error bars show the SE of means (n = 6). ** refers to significant differences between RNAi‐1# and WT with P < 0.01 determined by t‐test. (d) Quantitative PCR revealed more B. cinerea growing on the WT than on SlPL ‐RNAi fruit at 3 dpi. The B. cinerea growth was calculated by comparing the ratio of B. cinerea DNA to tomato DNA. (e) Relative expression level of PR‐1b in RNAi‐1# and WT fruit (Br+14) after inoculation with B. cinerea at 0, 1, 2 and 3 dpi. (f) Relative expression level of PR‐1a in RNAi‐1# and WT fruit (Br+14) after inoculation with B. cinerea at 0, 1, 2 and 3 dpi. For qPCR analysis, the data represent mean values for three independent biological replicates. * and ** indicate significant differences between SlPL ‐RNAi lines and WT with P < 0.05 and P < 0.01, respectively, as determined by t‐test.