
Figure 7.
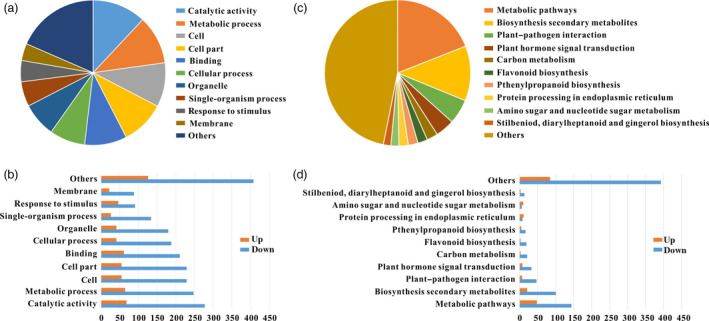
Classification of DEGs with RNA‐Seq data. (a) GO classification and functional annotation of the 943 genes showing more than twofold differences in expression between RNA‐1# and WT fruit at Br+4 stage. (b) Functional classification of all differentially expressed genes at Br+4 stage with GO classification. (c) Pathway and KEGG classification and functional annotation of the 943 genes showing more than twofold differences in expression between RNA‐1# and WT fruit at Br+4 stage. (d) Functional classification of all differentially expressed genes at Br+4 stage with pathway and KEGG classification.