
Figure 5.
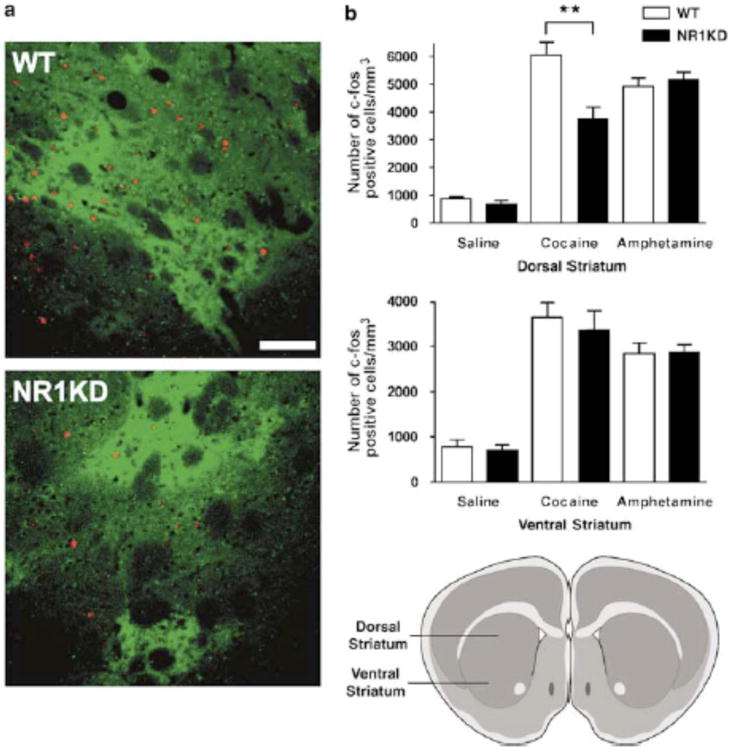
Effects of psychostimulants on c-fos protein expression in wildtype (WT) and NR1-KD mice. (A) Example of the pattern of c-fos expression 90 min after cocaine treatment (20 mg/kg i.p.) in the dorsal part of striatum (+1.20 mm from bregma) of WT and NR1-KD mice. c-fos –positive nuclei are stained red, and medium spiny neurons belonging to the direct output pathway are stained green using μ-opioid receptor antibody. Scale bar is 100 μm. (B) Number of c-fos positive neurons in dorsal striatum (+1.20 to +1.04 mm from bregma) is significantly lower in NR1-KD mice after cocaine (20 mg/kg i.p.) but not amphetamine (3 mg/kg i.p.) treatment, as compared to WT mice (n=4/group). **p < 0.01 compared to cocaine-treated WT mice (two-tailed t-test). Drawing of coronal slice illustrates region of dorsal and ventral striatum.