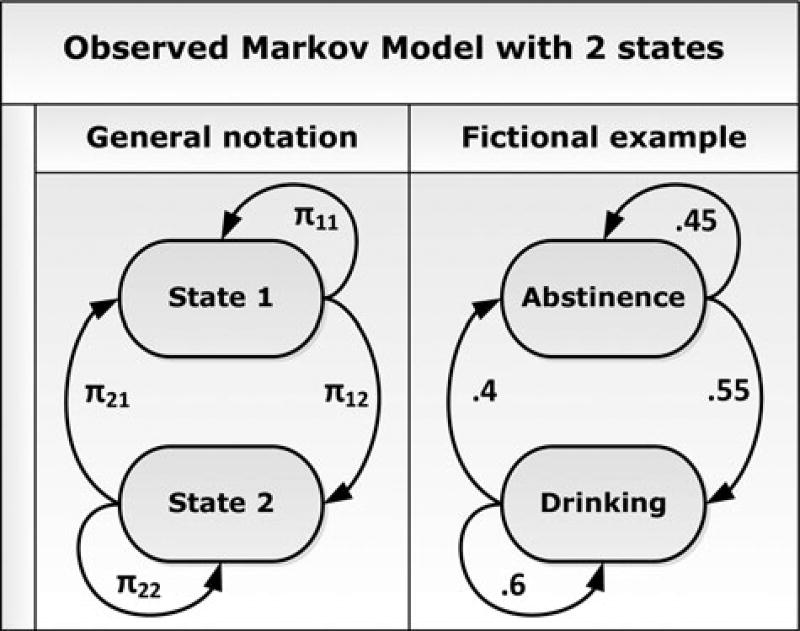
Figure 1.
Graphical representation of an OMM with two states. If a person is in a given state i at time t, the parameters next to the arrows running from that state represent the average probabilities of being in each state j at time t + 1. The right part portrays fictional parameter values concerning alcohol use.

