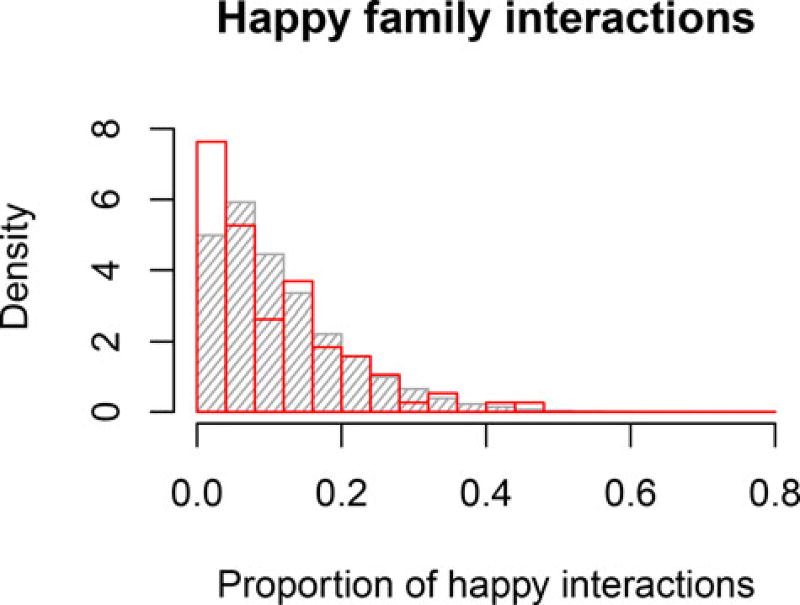
Figure 12.
Distribution of the proportion of happy interactions for empirical (in red) or model-predicted (in gray) families. In the empirical data, there were more families at the left end of the distribution, i.e., families where it rarely (or never) occurred that two family members behaved happily at the same time.

