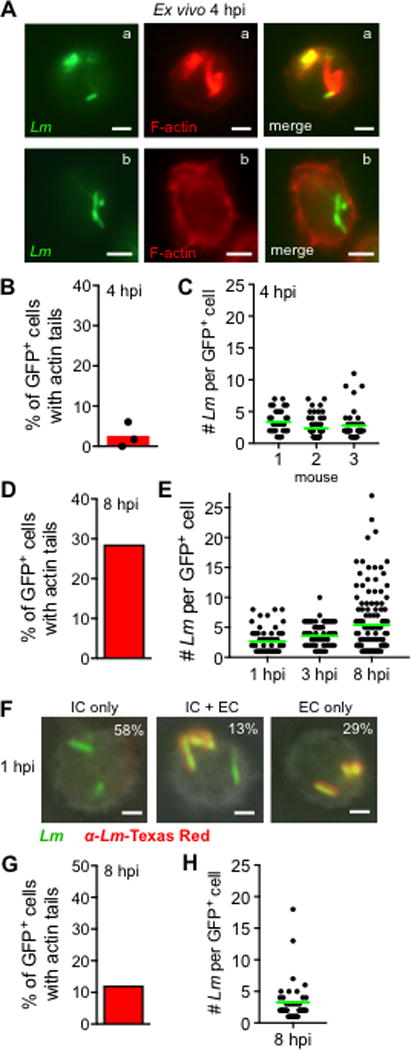
FIGURE 3.

Microscopic analysis of L. monocytogenes-infected CD11c+ cells. (A-C) CD11chi cells were sorted from the MLN of uninfected BALB mice and infected with Lm SD2710 (MOI=8) directly ex vivo for 1 h. Cells were spun onto slides and stained with phalloidin-Texas Red 4 hpi. (A) Representative images: cell in “a” contains Lm associated with actin tails and cell in “b” contains Lm not associated with actin. (B) Bar indicates mean percentage of GFP+ cells that had Lm associated with actin tails from each mouse (n=3). (C) Dots represent the number of Lm associated with each infected cell; horizontal green lines indicate mean values. (D-E) Bone marrow-derived CD11c+MHC-IIhi cells sorted after 6 d of culture in GM-CSF were infected for 30 min with Lm SD2710 (MOI = 0.2). A total of 300 cells were examined for each time point. (D) Percentage of Lm-infected cells that contained bacteria with actin tails. (E) Dots indicate the number of bacilli associated with each infected cell. (F-H) Bone marrow-derived cells cultured in FLT3-L for 6 d were infected with Lm SD2710 (MOI=1). (F) Representative images for differential “in/out” staining of unpermebilized cells spun onto slides and stained with Lm-specific antibodies 1 hpi. The percentage of cells with intracellular bacteria (IC only), both intracellular and extracellular (IC + EC), or only extracellular (EC only) are given in the upper right corner of each image. A total of 400 cells were counted. (G) Percentage of Lm-infected cells that contained bacteria with actin tails. (H) Dots indicate the number of Lm associated with each infected cell 8 hpi. Scale bars, 2 μm.
