
Figure 4. SIRT2 regulates Ang II-induced hypertrophy in neonatal rat cardiomyocytes (NRCMs).
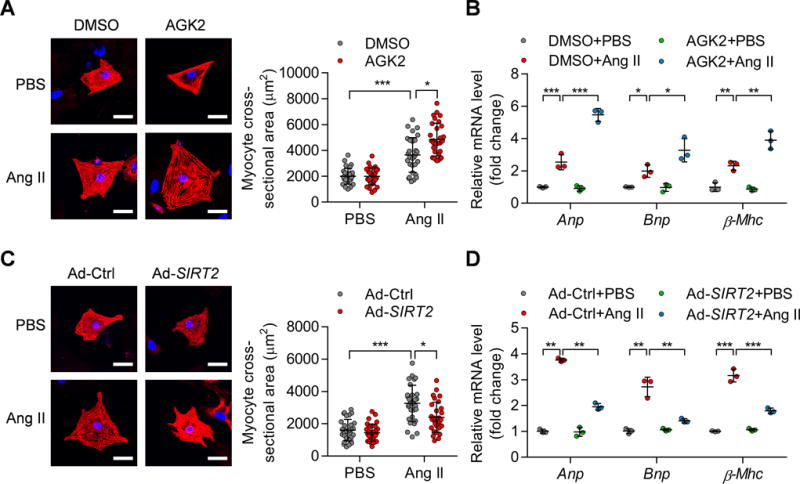
(A) NRCMs were treated with phosphate-buffered saline (PBS) or Ang II (1 μM) for 48 hours in the presence of AGK2 (10 μM) or DMSO. α-Actinin staining was performed to determine cell size. Representative images (Left) and quantification of cell size of total 30 NRCMs (Right) in each group are shown (scale bar=30 μm; *P<0.05, ***P<0.001).
(B) NRCMs were treated as shown in (A) and qRT-PCR was performed to analyze the mRNA levels of hypertrophic genes (Anp, Bnp, and β-Mhc). *P<0.05, **P<0.01, ***P<0.001.
(C) NRCMs were infected with the indicated adenovirus for 24 hours and then treated with PBS or Ang II (1 μM) for 48 hours. α-Actinin staining was performed to determine cell size. Representative images (Left) and quantification of cell size of total 30 NRCMs (Right) in each group are shown (scale bar=30 μm; *P<0.05, ***P<0.001). Ad-Ctrl: Control adenovirus; Ad-SIRT2: Adenovirus overexpressing human SIRT2.
(D) NRCMs were treated as shown in (C) and qRT-PCR was performed to analyze the expression of hypertrophic genes (Anp, Bnp, and β-Mhc). **P<0.01, ***P<0.001.