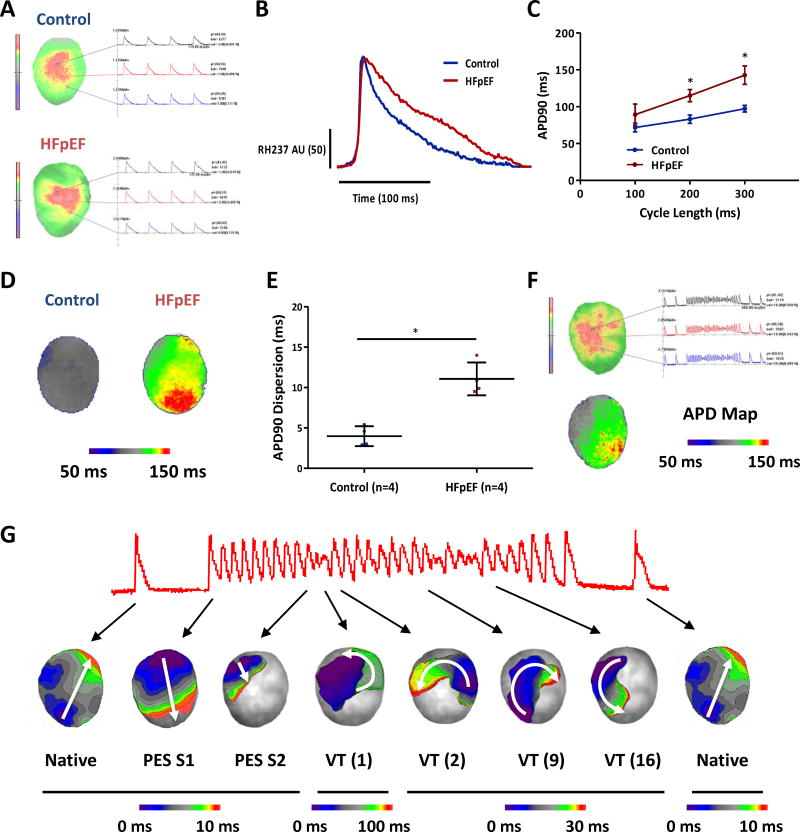
Figure 5. Optical mapping shows prolonged action potentials and polymorphic VT in HFpEF hearts.
A. Optical mapping of control and HFpEF hearts ex vivo showed action potential changes. B. Action potential prolongation in HFpEF is evident in representative recordings. C. Action potential duration 90% (APD90) is prolonged in HFpEF hearts compared to control hearts. Control rats n=4 and HFpEF rats n=4. D. Representative APD map of control and HFpEF hearts. E. APD dispersion was increased in HFpEF rats compared to controls. F. PES in a HFpEF rat elicited polymorphic VT. APD map of the rat heart showed heterogenous and dispersed APD G. Activation map analyses of the polymorphic VT showed multiple re-entry circuits. First 10 beats are caused by 10 S1 stimuli and next beat by single S2. There were approximately 22 VT beats and with variable clockwise or counter-clockwise rotation indicating multiple re-entry circuits. Of note, the site of block was found to be located at the region where the APD dispersion was high and this created the first re-entry circuit for the arrhythmia. Error line indicates mean and standard deviation. * denotes p < 0.05. AU: Arbitrary Unit. Mixed model regression with post-hoc testing (Tukey adjustment) was used for 5C and unpaired t-test was used for 5E.

