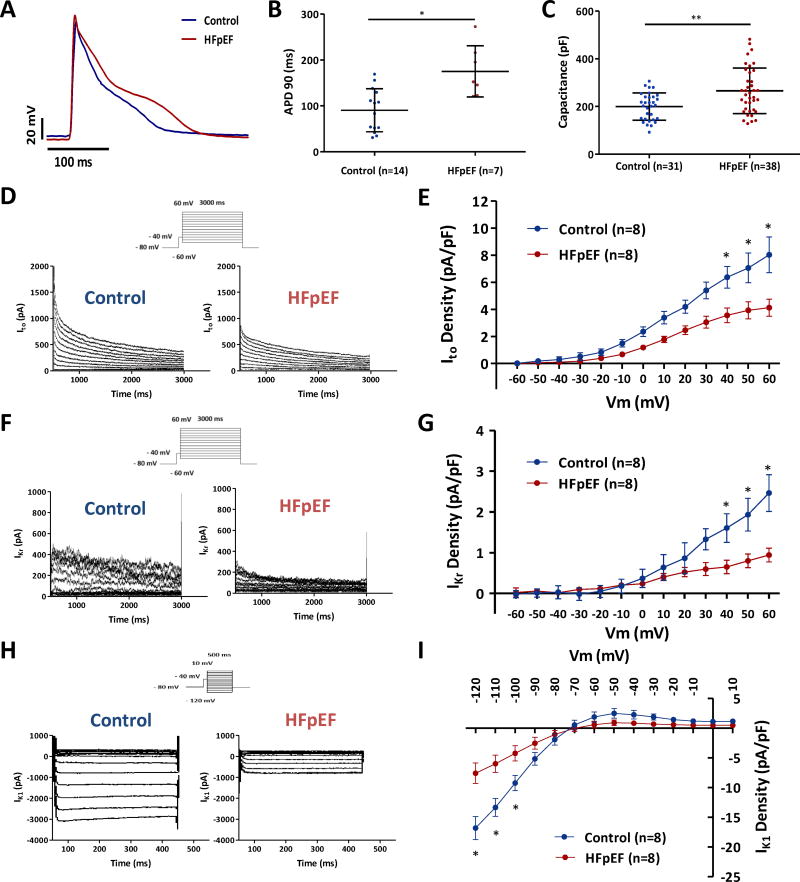
Figure 6. Prolonged action potential duration in HFpEF cardiomyocytes and down-regulation of potassium currents.
A. Representative action potentials in control and HFpEF cardiomyocytes. B. APD90 was prolonged in HFpEF cardiomyocytes compared to controls (n=14 cells from 4 control rats, and n=7 cells from 4 HFpEF rats). C. Cell capacitance was increased in HFpEF compared to control cardiomyocytes (n=31 cardiomyocytes from control rats, and n=38 cardiomyocytes from HFpEF rats). D, F, H. Representative Ito, IKr and IK1 recordings in control and HFpEF rats. E, G, I. Down-regulation of Ito, IKr and IK1 density in HFpEF rats compared to control rats (n=8 cardiomyocytes from n=4 rats each group). Error line indicates mean and standard deviation (6B-C) and standard error of mean (6E, G, I). * denotes p < 0.05 and ** denotes p < 0.001. Unpaired t-test was used for 6B, Wilcoxon rank sum test was used for 6C, and mixed model regression with post-hoc testing (Tukey adjustment) was used for 6E, G, I.

