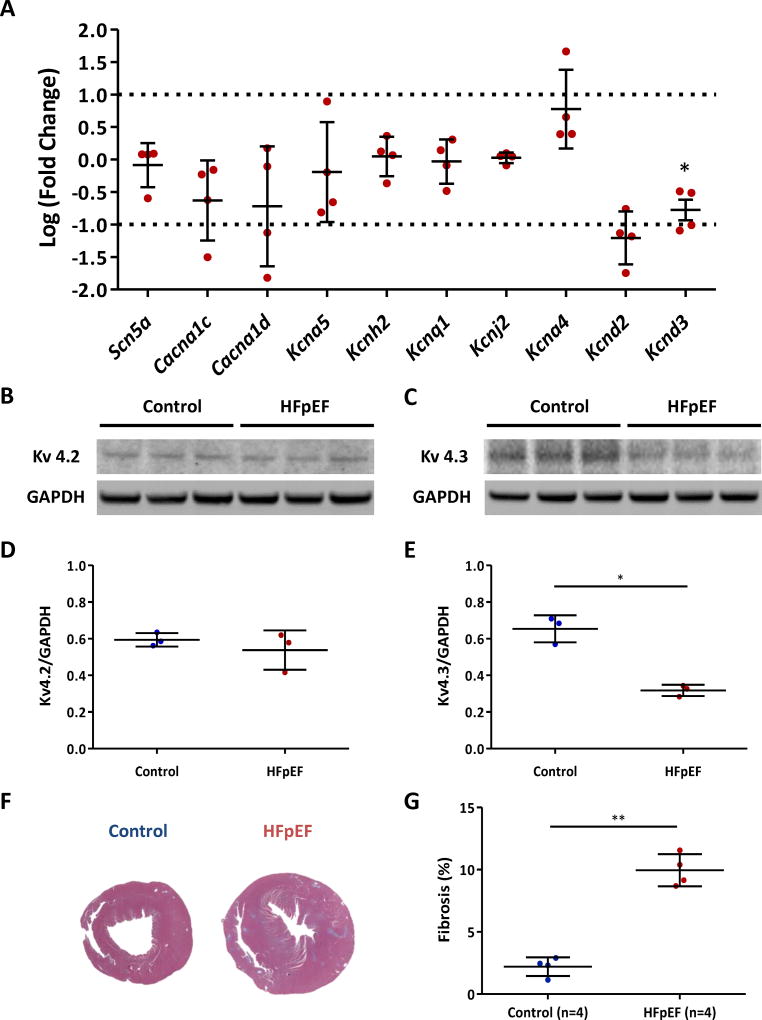
Figure 7. Transcript and protein levels of ion channel genes and fibrosis in control and HFpEF rats.
A. Quantitative reverse transcriptase PCR showed decreased expression of Kcnd2 and Kcnd3 mRNAs in HFpEF hearts compared to control hearts. Y axis indicates log (fold change). HFpEF rats n=4. B. Western blot of Kv4.2 showed no expression differences in the two groups. C. Kv4.3 expression was decreased in HFpEF rats compared to control rats. D. Kv4.2/GAPDH ratio did not differ between the two groups. n=3 rats each group. E. Kv4.3/GAPDH ratio was markedly decreased in HFpEF rats compared to control rats. n=3 rats each group. F. Representative Masson’s trichrome-stained sections of control and HFpEF hearts. G. Increased fibrosis in HFpEF hearts compared to controls. Error line indicates mean and standard deviation. * denotes p < 0.05 and ** denotes p < 0.001. Multiple t-tests were performed using step-down bootstrap sampling to control the familywise error rate at 0.05 for 7A, D and E, and unpaired t-test was used for 7G.

