
Figure 3.
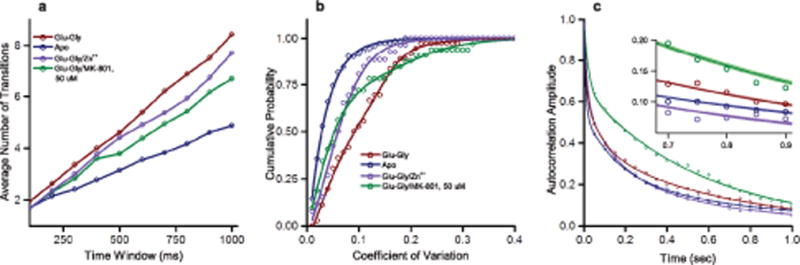
Dynamics of the NMDA receptor show differences in transitional behavior under different ligand conditions. The dynamics of the NMDA receptor in the apo, glu-gly, glu-gly with zinc, and glu-gly with 50 μM MK-801 bound states, as probed by (a) the average number of transitions seen per time window, (b) the cumulative probability plot of the coefficient of variation and (c) autocorrelation of the single molecule data fit to three-term exponential decay. The thickness of the lines represents the fitting errors (zoomed in for visibility in inset). Data for each molecule was obtained over a total acquisition time of, in seconds, 506.14, 330.36, 255.48, and 216.08, respectively.