
Figure 4.
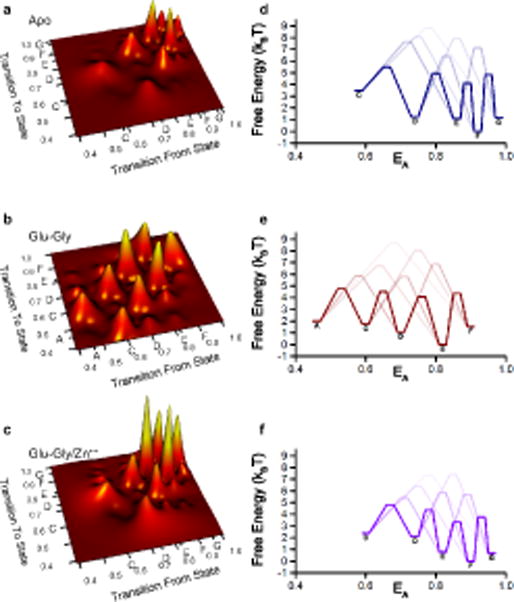
Transition maps and free energy diagrams of the NMDA receptor smFRET data. Examination of the individual single molecule traces show primarily transitions between adjacent states, portrayed here in terms of the normalized number of transitions for (a) apo, (b) glutamate-glycine bound, and (c) glutamate-glycine-bound zinc-inhibited NMDA receptors. Data from these transition maps were used to generate free energy diagrams (d–f). State designations as noted in Table 1 are shown on the axes in a–c and next to the energy well for the corresponding state in d–f.