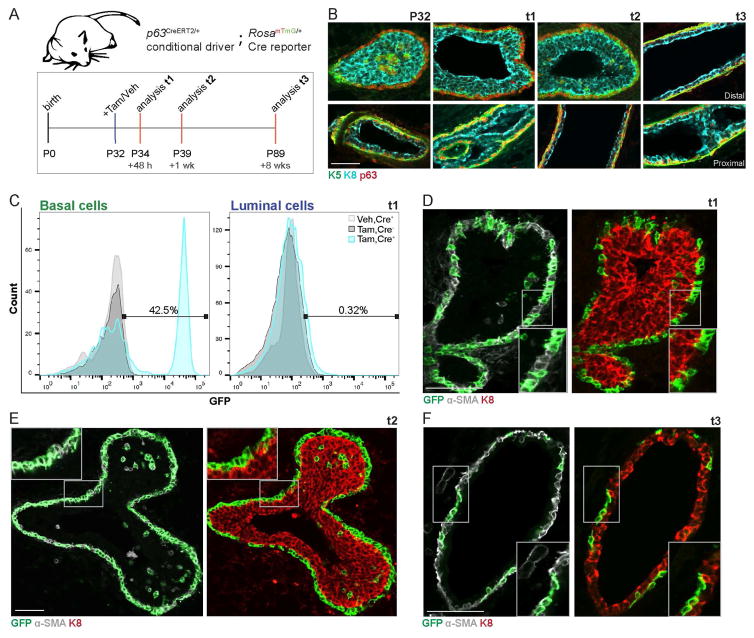
Fig. 1. Basal lineage-specific fate mapping identifies cap cells as unipotent.
(A) Timeline used for basal lineage fate mapping using p63CreERT2/+;RosamTmG/+ mice. (B) Representative IF images depicting total TP63 localization (red) relative to K5+ cap/basal cells (green) and K8+ body/luminal cells (cyan) at time points of interest for lineage-tracing. N.B. See Fig. S1B–D for proximal and distal notations. Scale bar=50μm. (C) Representative histograms (3 independent sorts, n=3 mice each) depict distribution of recombined, GFP+, and unrecombined, GFP− basal (left) and luminal (right) cells upon initial labeling +Tam in p63CreERT2/+;RosamTmG/+ mice (+Tam, Cre+; cyan histogram), +Tam in RosamTmG/+ mice (+Tam, Cre−; dark grey histogram), or +Veh in p63CreERT2/+;RosamTmG/+ mice (+Veh, Cre+; light grey histogram) at t1. (D) Representative IF images characterizing GFP+ cells relative to α-SMA+ cap/basal cells (grey) and K8+ body/luminal cells (red) at t1. Scale bar=50μm. n=3 mice. (E) Representative IF images characterizing GFP+ cells relative to α-SMA+ cells (grey) and K8+ (red) at t2. Scale bar=50μm. n=3 mice. (F) Representative IF images characterizing GFP+ cells relative to α-SMA+ cells (grey) and K8+ (red) at t3. Scale bar=50μm. n=3 mice. See also Fig. S1.

