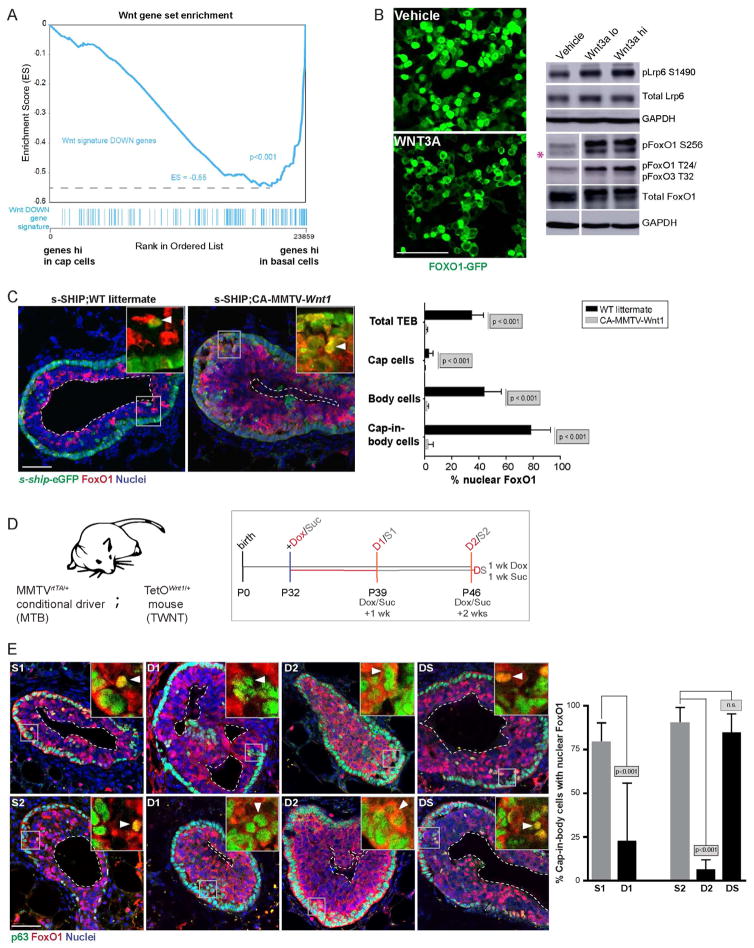
Fig. 4. WNT signaling regulates nuclear-cytoplasmic shuttling of FOXO1.
(A) GSEA of a WNT signature in cap versus basal cells. (B) Serum-starved 293T cells transfected with FOXO1-GFP were treated with Vehicle (PBS) or recombinant WNT3A (100ng/ml; WNT3A hi) and imaged 15 min later. Western blot analysis of indicated proteins in lysates derived from similarly treated 293T cells (Veh, WNT3A lo, WNT3A hi;15 min). GAPDH=loading control. The pink asterisk indicates the specific band. N.B. See Fig. S4D for the full blot with intervening insulin and H2O2 controls. (C) IF analysis of sections derived from s-SHIP;CA-MMTV-Wnt1 mice (middle) and s-SHIP only littermates (left) for s-ship-eGFP (green) and FOXO1 (red) in the hyperplastic TEBs. DAPI (blue)=nuclei. Scale bar=50μm. The right panel shows quantification. Arrowheads=cap-in-body cells. Dotted lines=lumens. n=3 mice, 8 TEBs each (WT littermate, CA-MMTV-Wnt1). (D) Experimental schedule for doxycycline (Dox) or sucrose (Suc) treatment of MTB/TWNT mice. (E) IF of stained tissue sections at endpoints from Fig. 4D were analyzed for localization of FOXO1 (red) in TP63+ cells (green). DAPI (blue)=nuclei. The insets show higher magnification snapshots comparing FOXO1 localization in cap and cap-in-body cells. N.B. Yellow cells=nuclear co-localization of FOXO1 and TP63. Arrowheads=cap-in-body cells. Dotted lines=lumens. Scale bar=50μm. Right panel shows quantification. n=2 mice, 9 TEBs each (S1, S2) and n=3 mice, 9 TEBs each (D1, D2, DS).
Error bars=mean ± SD. See also Fig. S4.

