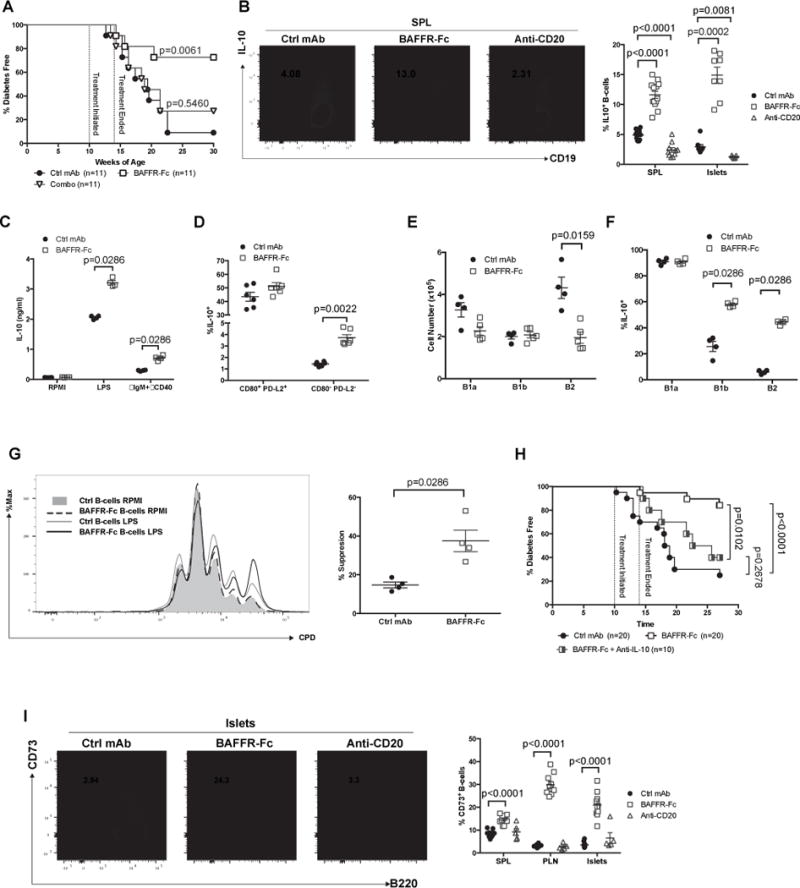
Figure 4. Short-term BAFFR-Fc mediated B-lymphocyte depletion elicits prolonged T1D protection and remaining B-lymphocytes are regulatory in nature.

A) NOD female mice treated with BAFFR-Fc alone or combination with anti-CD20 between 10–14 weeks of age were assessed for diabetes development. Diabetes development in each of these experimental groups was statistically compared to NOD females treated with ctrl mAb from 10–14 weeks of age (Mantel-Cox analysis). B) Representative flow cytometric plot showing frequency of B10 cells among CD19+ cells in spleens of NOD mice treated with ctrl mAb, BAFFR-Fc, or anti-CD20 from 10–14 weeks of age (left panel). Summary of the percentage of B10 cells in the spleens and islets (right panel). Data pooled from three and two independent experiments for B10 cells in the spleens and islets respectively. C) 1.0×10⁵ sort-purified splenic B-lymphocytes from ctrl mAb or BAFFR-Fc-treated NOD mice were cultured for 3 days with or without LPS or anti-IgM plus anti-CD40 and culture supernatant was subsequently measured by ELISA for IL-10. Data pooled from two independent experiments. D) Frequency of B10 cells amongst CD80+ PD-L2+ or CD80− PD-L2− B-lymphocytes in spleens of NOD mice treated with ctrl mAb or BAFFR-Fc from 10–14 weeks of age. E-F) Number of B1a, B1b, B2 B-lymphocytes in the peritoneal cavity (E) and percentage of B10 cells within the B1a, B1b, B2 B-lymphocytes subsets (F) in NOD female mice treated with ctrl mAb or BAFFR-Fc from 10–14 weeks of age. G) 1.0×10⁵ CD25− CD4+ T-cells from 10 week-old NOD mice were labeled with Cell Proliferation Dye eFluor450 (CPD) and then stimulated with 5 μg/mL plate bound anti-CD3ε and co-cultured for 3 days with 1.0×10⁵ sorted splenic B-lymphocytes from ctrl mAb or BAFFR-Fc-treated NOD mice with or without 10 μg/mL LPS stimulation (left panel). Quantification of percent T-cell proliferation suppression (right panel) (n=4 per group). Data are representative of two experiments. H) NOD female mice treated with BAFFR-Fc or ctrl mAb between 10–14 weeks of age were assessed for diabetes development. Upon cessation of transient BAFFR-Fc monotherapy a separate cohort of NOD females subsequently received twice-weekly injections of anti-IL-10 while being monitored for diabetes development. Pair-wise comparisons of diabetes development between each group were calculated using Mantel-Cox analysis. I) Representative flow cytometric plots showing islet infiltrating B-lymphocytes expressing CD73 among live CD19+ B220+ cells from NOD mice treated with ctrl mAb, BAFFR-Fc, or anti-CD20 from 10–14 weeks of age (left panel). Percent CD73+ B-lymphocytes from spleens, PLNs, or islets of NOD mice treated with ctrl mAb, BAFFR-Fc, or anti-CD20 from 10–14 weeks of age (right panel). Data pooled from two independent experiments. All p-values were calculated using Mann-Whitney analyses. Each symbol represents an individual mouse except for BAFFR-Fc group in C and D where each symbol represents sorted B-lymphocytes pooled from 2 or 3 mice; small horizontal lines indicate the Mean±SEM.
