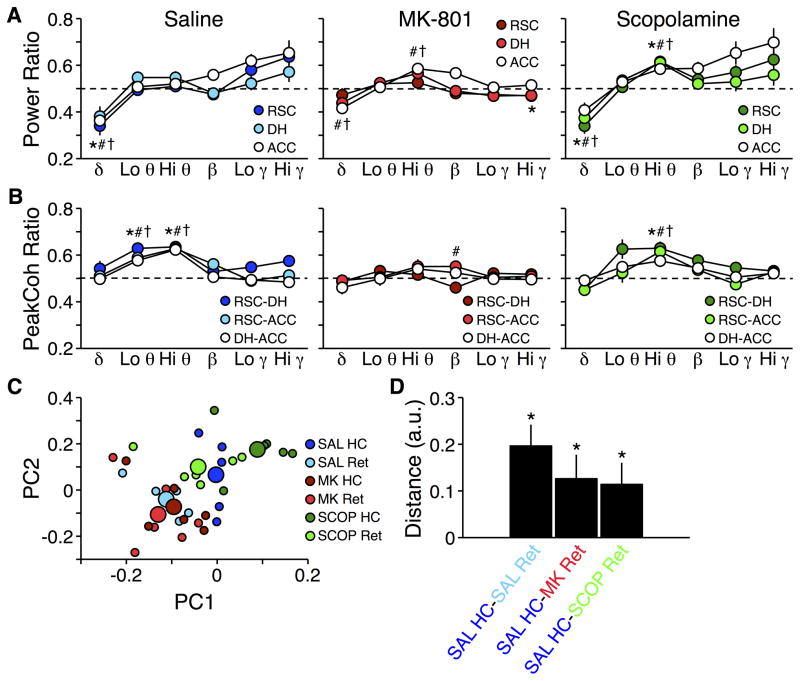
Figure 4.
Power and peak coherence ratios during memory retrieval after drug injections. A) Power recorded during retrieval tests relative to post-injection recording sessions in the home cage. *, #, † p ≤ 0.01 vs. home cage for RSC, DH, and ACC power, respectively. B) Same as A for peak coherence. *, #, † p ≤ 0.01 vs. home cage for RSC-DH, RSC-ACC, and DH-ACC peak coherence, respectively. Dashed lines indicate no change from post-injection recording sessions in the home cage (ratio of 0.5). C) Plot of the first two principal components derived from recordings made in the home cage post-injection (HC) and during the retrieval test (Ret). Small symbols represent individuals in each session; large symbols represent the average for each session. D) Mean Euclidian distances between clusters in C. * Difference to hypothetical mean of 0 is non-negative and p < 0.01.

