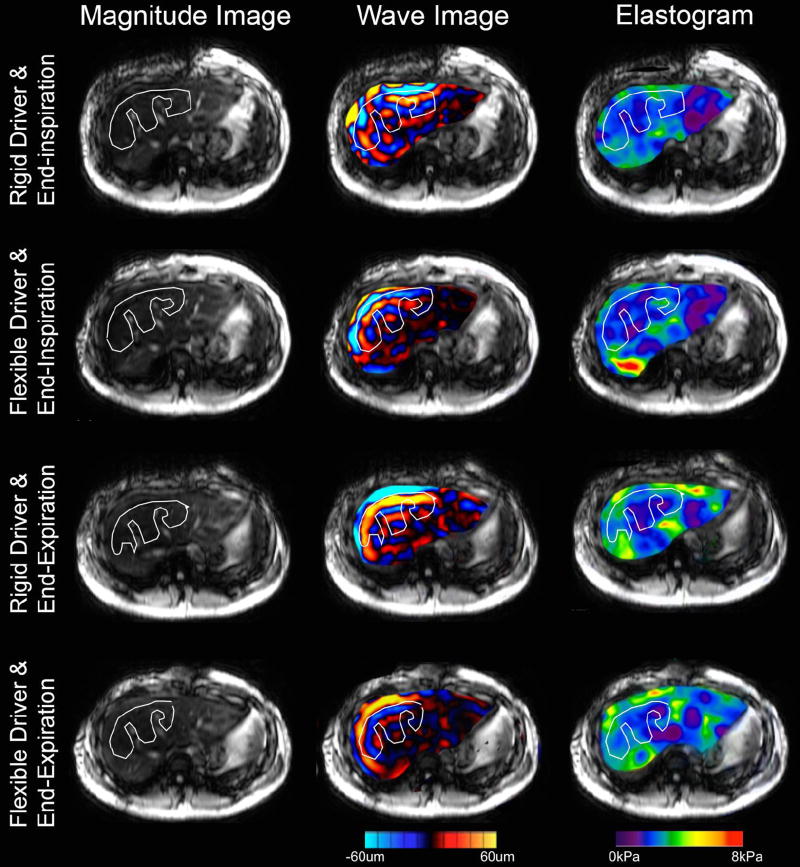
Figure 1.
Example of 2D MRE generated data for one subject at each combination of respiratory phase and driver type. Each row represents the magnitude image (left), wave image (middle), and elastogram (right) from one 2D MRE scan. For the wave image and the elastogram, only the region within the liver is shown and overlaid on the magnitude image for easier visualization. The white line represents the manually traced region of interest (ROI). The elastogram is color coded from purple to red for stiffness range from 0 to 8 kPa. The wave images are color coded with red in the positive direction and blue in the negative direction; the magnitude is coded by the brightness.

