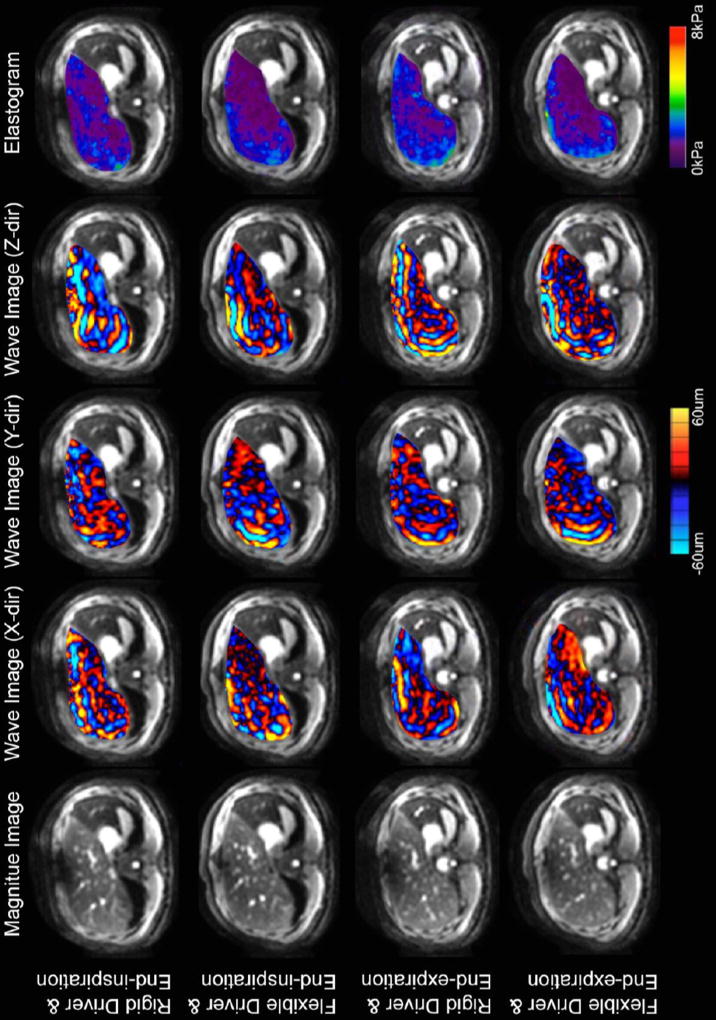
Figure 2.
Example of 3D MRE generated data for one subject at each combination of respiratory phase and driver type. Each row represents the magnitude image, elastogram, and three sets of wave image from one 3D MRE scan. The wave images depicted tissue displacements along the x-direction, y-direction, and z-direction respectively.

