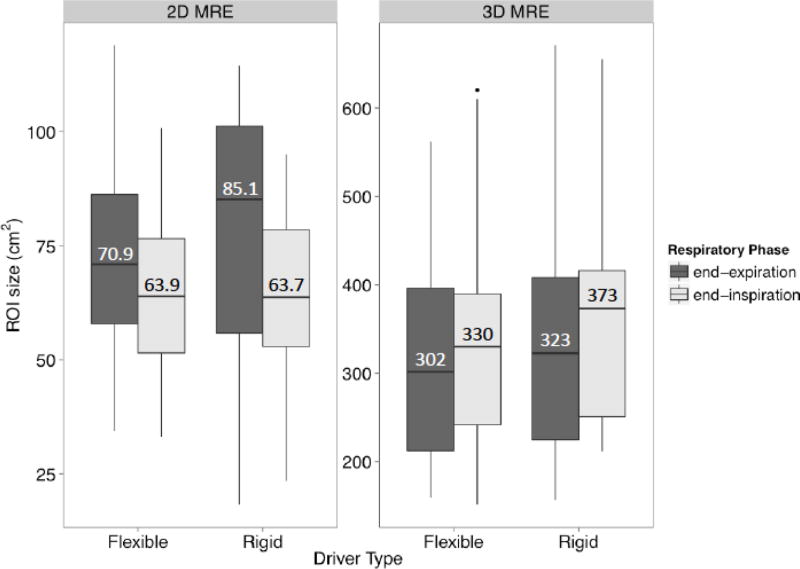
Figure 4.
Boxplots summarizing ROI sizes for 2D and 3D MRE under different conditions. For each MRE method, the boxplots are grouped by driver type (different columns) and then by breath-hold phase (different shading). ROI sizes between methods are not comparable due to differences in the numbers of acquired slices (4 for 2D MRE, 28–32 for 3D MRE).

