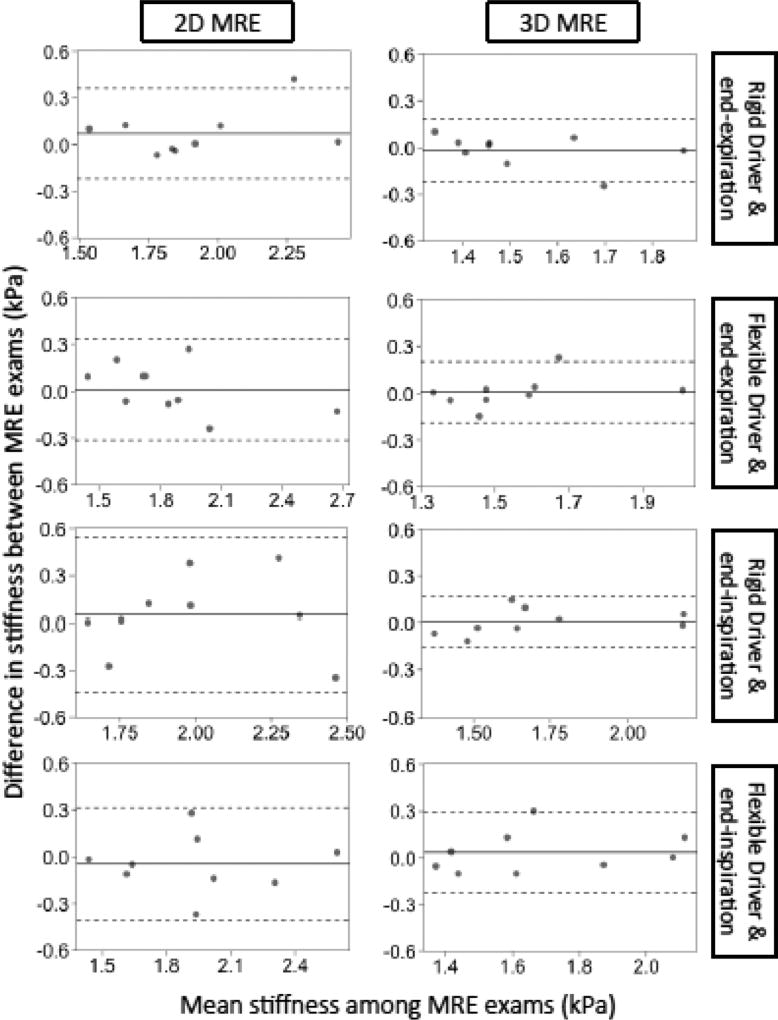
Figure 5.
Bland-Altman plots for the repeatability of 2D and 3D MRE under different conditions. The horizontal axis is the mean stiffness between exam 1 & 2 and the vertical axis is the difference in stiffness between exam 1 & 2. The dotted lines represent the interval of the limit of agreement (LOA) in Table 2.

