
Figure 1.
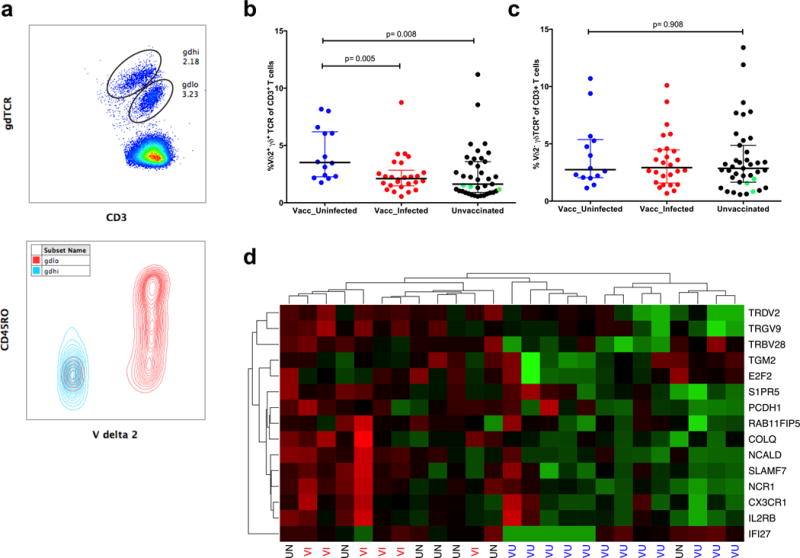
Vδ2 T cell levels after the fifth vaccination were highest in vaccinees who remained uninfected throughout follow-up a) Representative histogram showing two populations of γδ T cells identified by differential levels of γδ TCR expression (top panel) and an overlay of Vδ2 population on total γδ T cells (bottom panel). Comparison of the percentage of (b) Vδ2+γδTCR+ T cells and (c) Vδ2−γδTCR+ T cells in vaccinees who remained uninfected throughout follow-up (blue dots) compared to vaccinees who developed parasitemia (red dots) or to unvaccinated individuals (black dots). Green dots are the unvaccinated individuals who remained uninfected. (d) Heatmap with hierarchical clustering of RNAseq data showing the top 15 genes that were differentially expressed between vaccinated/uninfected (VU), vaccinated/infected (VI) and unvaccinated (UV) study volunteers 3 days after the fifth vaccination. Upregulated genes are denoted in green and downregulated genes are in red.