Figure 1.

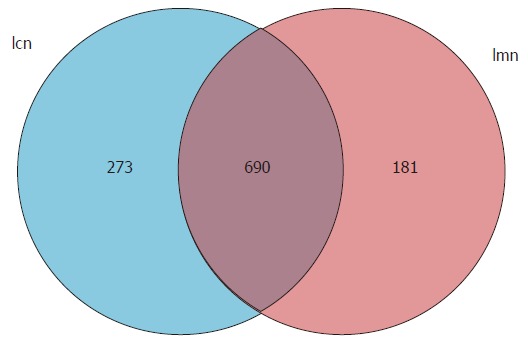
Venn diagram of operational taxonomic units based on the sequences with over 97% similarity under a similar level of clustering. lcn: Control group; lmn: Model group.

Venn diagram of operational taxonomic units based on the sequences with over 97% similarity under a similar level of clustering. lcn: Control group; lmn: Model group.