
Figure 2.
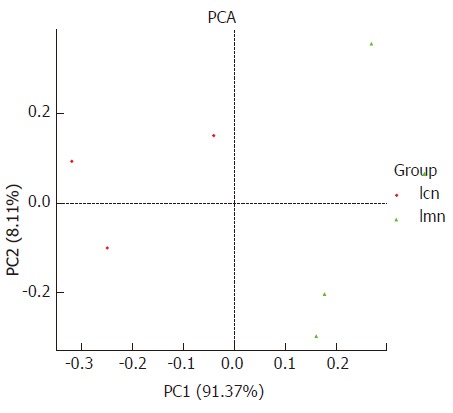
Principal component analysis diagram of bacterial lactase gene similarity at genus level based on DNA sequence data. Each point in the figure represents a sample. Points with the same color belong to the same group. The closer the distance between two points, the smaller the difference in the microbial community. lcn: Control group; lmn: Model group;PCA: principal component analysis.