Figure 5.

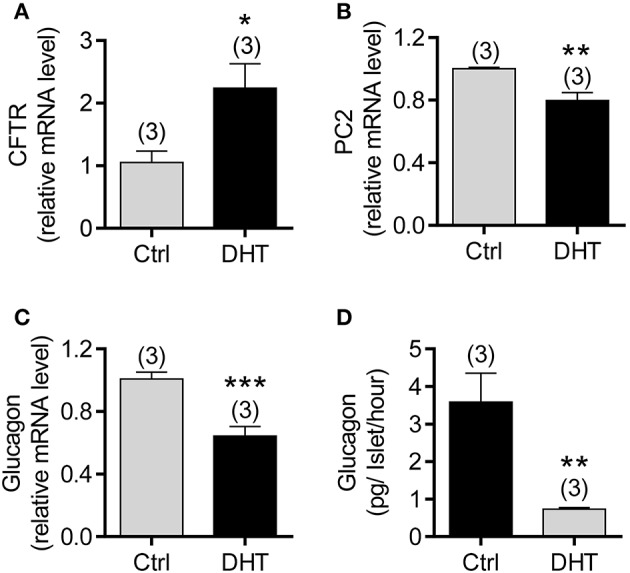
Effect of DHT on CFTR expression in α cells of isolated mouse islets. (A–C) qPCR of CFTR (A), PC2 (B), and glucagon (C) in mouse islets after exposed to DHT (100 nM) or ethanol as the vehicle control (Ctrl) for 48 h. *P < 0.05, **P < 0.01, ***P < 0.001, t-test. n is shown in each column. (D) ELISA of glucagon levels in the KRB solution with 1 mM glucose after 2 h incubation with isolated mouse islets. The islets were pretreated with DHT (100 nM) or the vehicle control (Ctrl) for 48 h. **P < 0.01, t-test. The experiments were repeated at least three times.
