Figure 6.
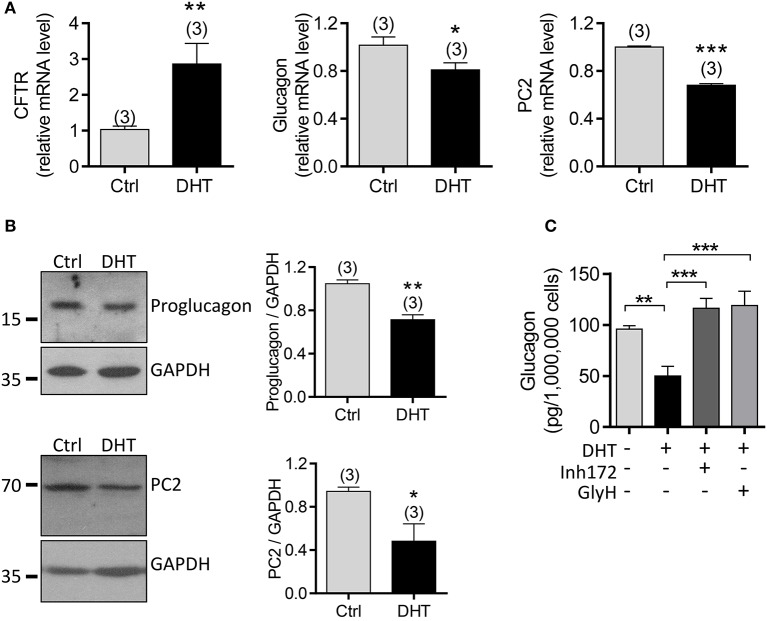
Involvement of CFTR in DHT-induced glucagon expression in αTC1-9 cells. (A,B) qPCR of CFTR, glucagon and PC2 (A) and western blot for proglucagon and PC2 (B), with quantitation on the right) in αTC1-9 cells exposed to DHT (100 nM) or ethanol as the vehicle control (Ctrl) for 48 h. *P < 0.05, **P < 0.01, ***P < 0.001, t-test. n is shown in each column. (C) ELISA of glucagon levels in KRB solution containing 1 mM glucose after 1 h incubation with αTC1-9 cells, pre-incubated with DHT (100 nM), the CFTR inhibitors, Inh172 (10 μM) or GlyH-101 (GlyH, 10 μM) for 48 h. **P < 0.01 ***P < 0.001, One way ANOVA. The experiments were repeated at least three times.

