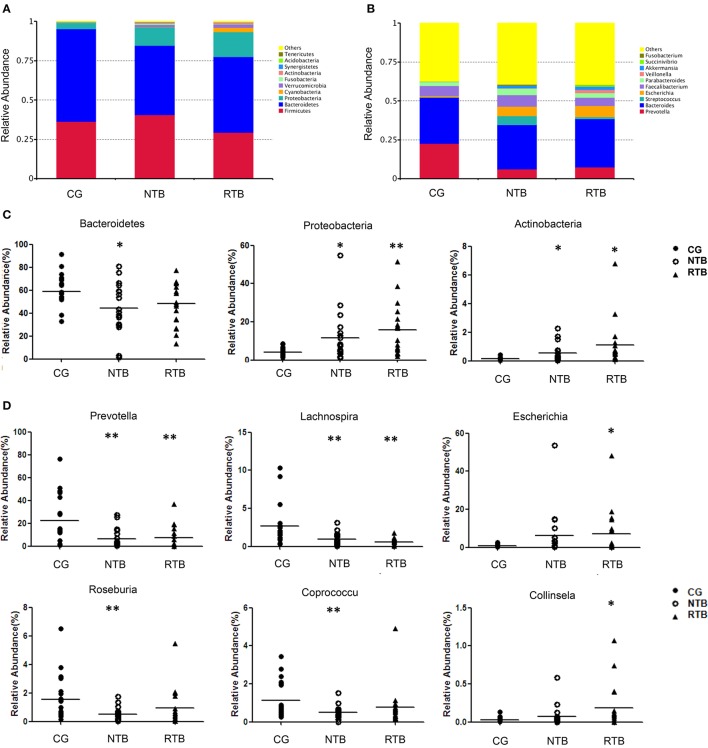
Figure 3.
The major gut bacterial phyla and genus in new and recurrent tuberculosis patients as well as the healthy control. (A) Bacterial phylum levels of new and recurrent tuberculosis groups, NTB and RTB respectively. (B) Bacterial genus levels. (C) Comparison of gut microbiota of relative abundance at the bacterial phylum levels. (D) Comparison of gut microbiota of relative abundance at genus levels. The p-values were calculated using T-test, and significance was compared against the CG. *P < 0.05. **P < 0.01.

