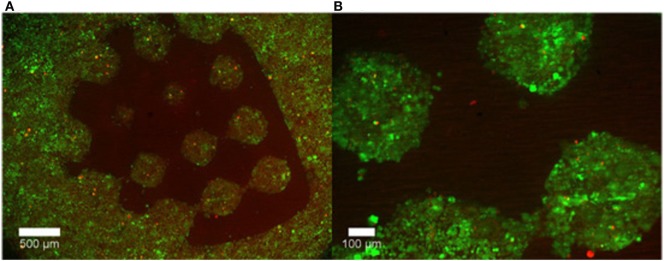
Figure 3.
Representative images of cell growth in (A) the permissive region (puramatrix/agarose) versus (B) PEG after 48 hours. Live cells are labelled with calcein (green) while dead cells are labeled with ethidium homodimer-1 (red). Reprinted from Curley et al. (2011) under a Creative Commons License 3.0.

