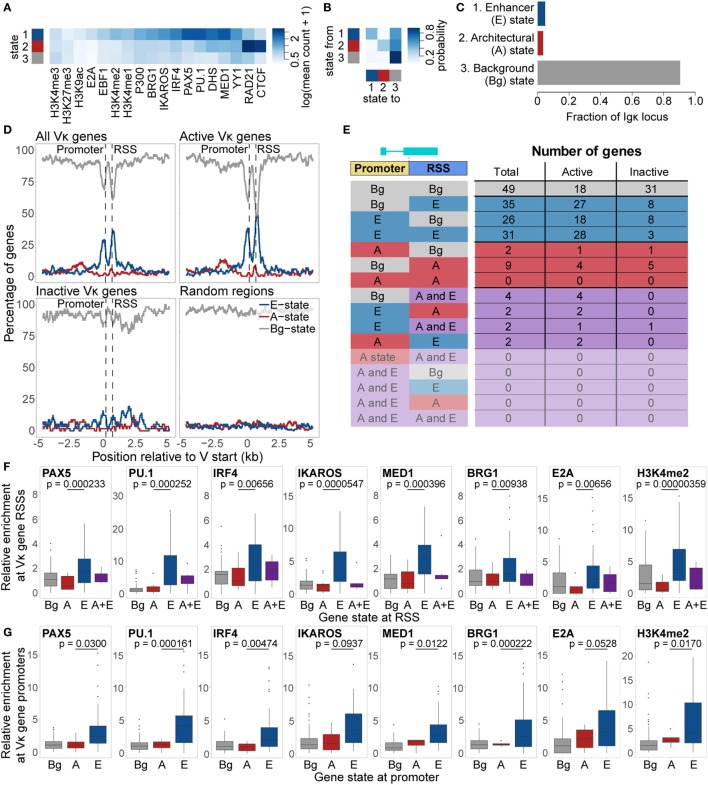
Figure 5.
Chromatin state analysis of the Igκ locus. (A,B) Feature enrichment (A) and transition matrix (B) for states identified by the EpiCSeg algorithm when three states are specified. (C) Proportion of the Igκ locus that is in each state. State 1 was labelled as the “Enhancer” state (E State), state 2 as the “Architectural” state (A state), and state 3 as the “Background” state (Bg state). (D) Percentage of regions in the A, E, and Bg state, over and surrounding all Vκ genes, active and inactive Vκ genes separately, or random regions of equivalent size distribution. Vκ genes have been scaled to the median gene length (525 bp), while distances surrounding the genes are not scaled. (E) Number of genes in each state, and the locations at which those states are present. (F,G) Enrichment relative to background of chromatin features characteristic of the E state over Vκ recombination signal sequences (RSSs) (F) and promoters (G) associated with each state. Fdr-adjusted p-values from a two-sided Wilcoxon rank sum test are shown for the difference in enrichment between A and E state-associated promoters or RSSs. All data are included for statistical testing, but to better visualise the data, some outliers are not displayed.

