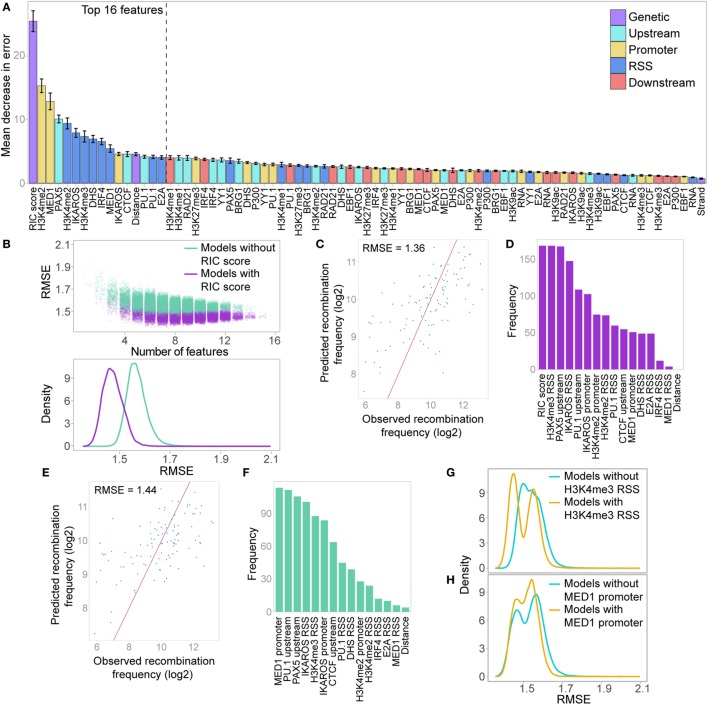
Figure 8.
Random forest regression (RF-R) model for predicting recombination frequency of active Vκ genes. (A) Relative importance of all features in a RF-R model. Importance assessed by average out-of-bag node purity (a measure of the decrease in accuracy if the feature is excluded), with 10-fold cross validation. Error bars indicate the SEM. (B) Model selection, assessing all combinations of the 16 most important features from the initial RF-R model. Model performance is assessed as the root mean squared error (RMSE) across all test sets with 10-fold cross-validation. Colour denotes whether the RSS Information Content (RIC) score was included in the model as a feature. Top: scatter plot showing the RMSE of models with varying numbers of features; Bottom: density plot showing the distribution of the RMSE for all models that include or exclude the RIC score. (C,E) Observed versus predicted recombination frequencies across all test sets for the optimum RF-R model that included (C) or did not include (E) the RIC score as a feature, as assessed by RMSE. Observed = predicted is shown as a red line. (D,F) Frequency of inclusion of each feature in all models that included the RIC score and had an RMSE <1.39 (D), or that excluded the RIC score and had an RMSE <1.48 (F). (G,H) RMSE across all test sets for RF-R models that included H3K4me3 RSS (G) or MED1 promoter (H) as a feature compared to those that did not.

