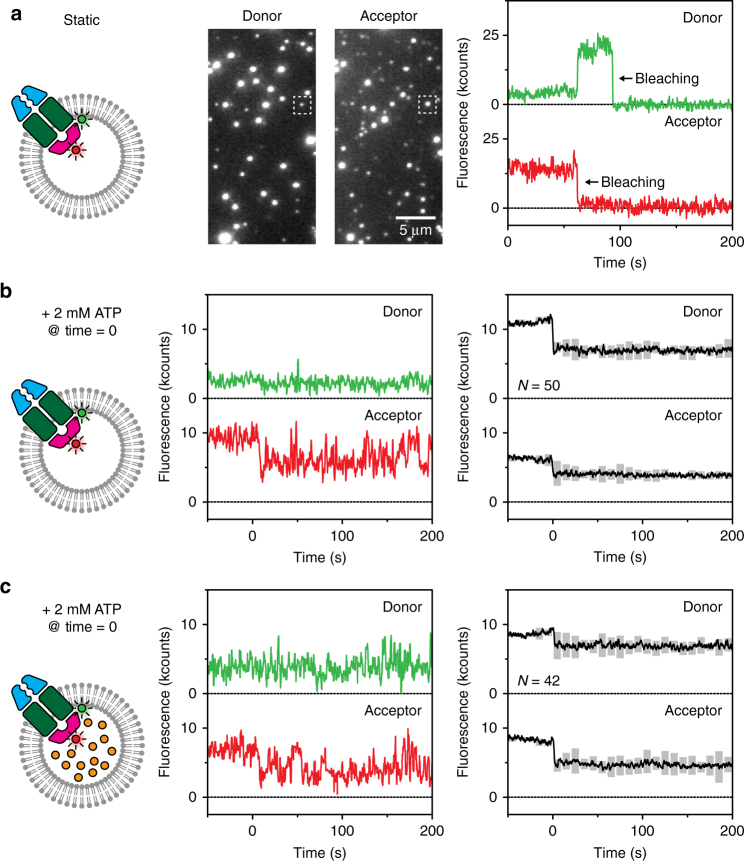
Fig. 2.
Complex formation observed with FRET. a A stable complex of BtuCDcys (Alexa Fluor 555) and BtuF (Alexa Fluor 647) was formed when reconstituted in substrate-free liposomes. The middle panel shows a section of a field of view. On excitation of donor fluorophores (left channel), emission of acceptor fluorophores was visible (right channel), which is an indication of FRET and thus complex formation. The right panel shows the fluorescence traces of the spots marked with a square. A 2.5× higher laser power density was used to promote bleaching of the dyes, here visible at ~65 and ~100 s. b The same complex as in a was used, but now ATP and Mg2+ were introduced at time zero. The total intensity (sum of donor and acceptor fluorescence) decreased when ATP was present, and dynamics in the signal are visible (middle panel). The right panel shows the average of all traces where a drop in total intensity was observed upon introduction of ATP; the pair of traces shown in the middle panel is one of them. The grey floating bars indicate the number of times the signal exceeded a threshold (see Methods), and thus report on the extent of the fluctuations increasing at positive times. In total, over 1000 fluorescence traces were analysed. c Similar experiment as described in b, but with 100 µM vitamin B12 introduced to the lumen of the vesicles

