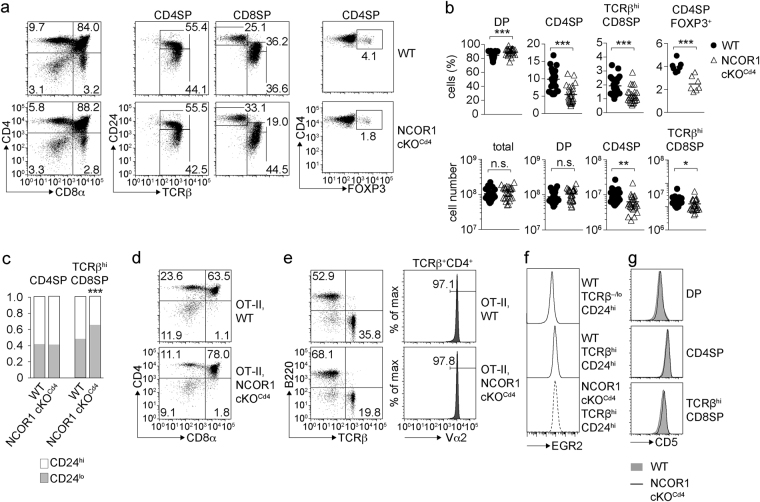
Figure 2.
Mature SP thymocytes are reduced in NCOR1 cKOCd4 mice. (a) Flow cytometry analysis of CD4, CD8α, TCRβ, CD24 and FOXP3 expression in WT and NCOR1 cKOCd4 thymocytes. The middle panel shows CD24 and TCRβ expression on CD4SP and CD8SP thymocytes. (b) Percentages and cell numbers of all thymocytes, DP, CD4SP and TCRβhi CD8SP thymocytes, as well as percentages of FOXP3+ T cells within the CD4SP subset in WT and NCOR1 cKOCd4 mice. (c) Bar diagrams show the relative distribution of CD24hi and CD24lo cells within the CD4SP and TCRβhi CD8SP subsets. (d) Expression of CD4 and CD8α on thymocytes isolated from OT-II,WT and OT-II,NCOR1 cKOCd4 littermates. (e) Flow cytometry analysis of B220 and TCRβ expression on splenocytes isolated from OT-II,WT and OT-II,NCOR1 cKOCd4 littermates. Histograms depict Vα2 expression on TCRβ+ CD4+ OT-II T cells. (f) Histogram depicts EGR2 expression in immature (TCRβhiCD24hi) thymocytes of WT and NCOR1 cKOCd4 mice. WT TCRβ−/lo CD24hi DP thymocytes were used as a negative staining control. (g) Histograms depict CD5 expression on DP (upper panel), CD4SP (middle panel) and TCRβhi CD8SP (lower panel) thymocytes in WT and NCOR1 cKOCd4 mice. (a,d,e) Numbers indicate the percentage of cells in the respective quadrants. (b) Thick horizontal bars indicate the mean. (b,c) *P < 0.05, **P < 0.01 and ***P < 0.001 (unpaired two-tailed Student’s t-test). Data are representative (a,d,e,f,g) or show the summary (b,c) of 7–10 mice (a,c), 25–26 mice (b; except for CD4SP FOXP3+ cells, where n = 7 mice) and 5–6 mice (d,e,f,g) that were analyzed in 3–4 (a,c), 8 (b; except for CD4SP FOXP3+ cells: 3), 3 (d,e,g) and 2 (f) independent experiments.

