Figure 6.
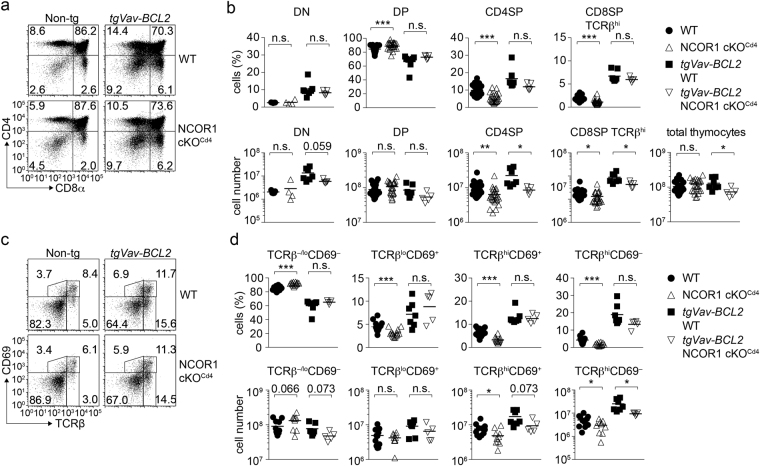
Transgenic expression of BCL2 rescues the generation of NCOR1 cKOCd4 SP thymocytes. (a) Flow cytometry analysis of CD4 and CD8 expression on thymocytes isolated from WT and NCOR1 cKOCd4 mice that are non-transgenic (left panel) or transgenic for Vav-BCL2 (right panel). (b) Percentages (upper panel) and cell numbers (lower panel) of DN, DP, CD4SP and TCRβhi CD8SP thymocytes in WT and NCOR1 cKOCd4 mice that are non-transgenic or transgenic for Vav-BCL2 are shown. (c) Flow cytometry analysis of CD69 and TCRβ expression on thymocytes isolated from WT and NCOR1 cKOCd4 mice that are non-transgenic (left panel) or transgenic for Vav-BCL2 (right panel). (d) Percentages (upper panel) and cell numbers (lower panel) of TCRβ−/loCD69−, TCRβloCD69+, TCRβhiCD69+ and TCRβhiCD69− thymocytes in WT and NCOR1 cKOCd4 mice that are non-transgenic and transgenic for Vav-BCL2 are indicated. (a,c) Numbers indicate the percentage of cells in the respective quadrants or regions. (b,d) Thick horizontal bars indicate the mean; *P < 0.05, **P < 0.01 and ***P < 0.001, n.s., not significant; unpaired two-tailed Student’s t-test. Data are representative (a,c) or show the summary (b,d) of 9–15 (for non transgenic mice; non-tg) and 5–9 (for tgVav-BCL2 mice) mice that were analyzed in 4–7 independent experiments. (b,d) The data for WT and NCOR1 cKOCd4 mice in (b; except DN subsets) and (d) were already shown in Figures 2b and 4e, respectively.

