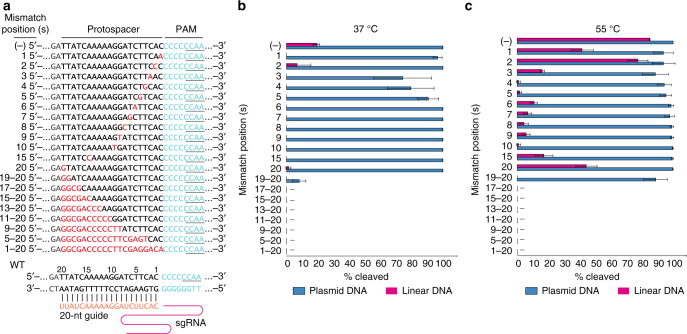
Fig. 4.
Protospacer targeting Specificity of ThermoCas9. a Scheme of the generated mismatch protospacers library, employed for evaluating the ThermoCas9:sgRNA targeting specificity in vitro. The mismatch spacer-protospacer positions are shown in red, the PAM in light blue with the fifth to eighth positions underlined. b Graphical representation of the ThermoCas9:sgRNA cleavage efficiency over linear or plasmid targets with different mismatches at 37 °C. The percentage of cleavage was calculated based on integrated band intensities after gel electrophoresis. Average values from three biological replicates are shown, with error bars representing S.D. The blots of one of the replicates are shown in Supplementary Fig. 12. c Graphical representation of the ThermoCas9:sgRNA cleavage efficiency over linear or plasmid targets with different mismatches at 55 °C. The percentage of cleavage was calculated based on integrated band intensities after gel electrophoresis. Average values from three biological replicates are shown, with error bars representing S.D. The blots of one of the replicates are shown in Supplementary Fig. 12

