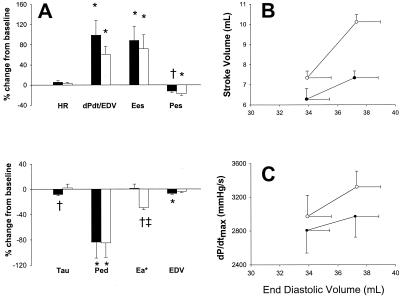
Figure 2.
(A) Mean ± SEM for % change in hemodynamics for AS (black bars, n = 9) vs. AS in the presence of preload-volume restoration (white bars, n = 4). HR, heart rate; dPdt/EDV, slope of dP/dtmax-end-diastolic dimension; Pes, end-systolic pressure; Tau, time constant of pressure decay; Ped, end-diastolic pressure; Ea, arterial elastance; EDV, enol-diastolic volume. *, P < 0.05 vs. baseline; †, P < 0.01 vs. baseline; ‡, P < 0.01 vs. nitroxyl alone. (B and C) Cardiac function curves showing stroke volume (B) and maximal rate of pressure rise (C) at two different end diastolic volumes. Control curves (●) were significantly shifted upward after AS infusion (○).

