Figure 1.
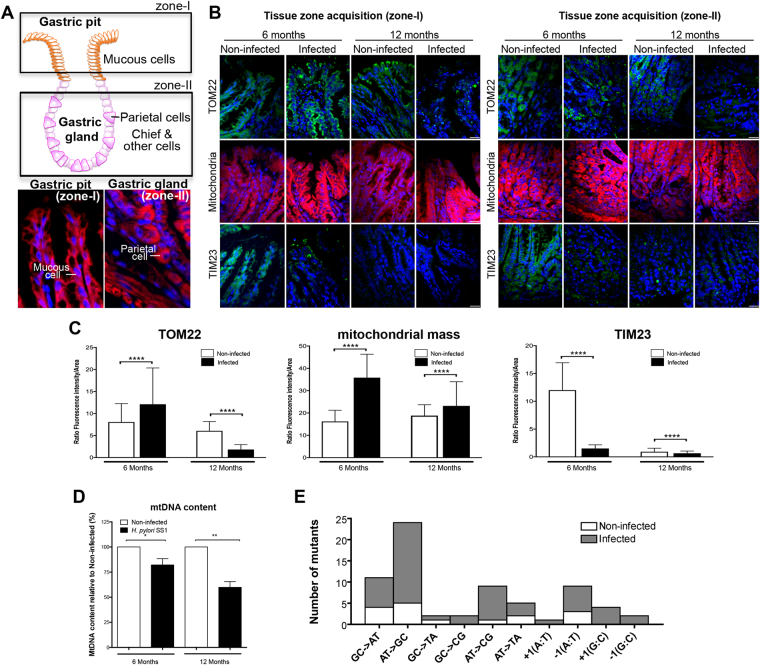
H. pylori deregulates mitochondrial mass and mitochondrial translocases in INS-GAS mice. (A) Structure and cell types in gastric glands. Rectangles indicate the zones (I and II) that have been analysed. The expected cell types in each zone are indicated in the panels below (red, Mitotracker, blue, Hoechst). (B) TOM22, TIM23 immunofluorescence and MitoTracker staining on gastric pits (zone I, left panels) and gastric glands (zone II, right panels) on tissue section from 6–12 months H. pylori SS1-infected INS-GAS mice. (C) Quantification of fluorescence intensity (performed on 1600 cells (750 cells in zone I, 750 non-triangular shaped cells and 100 triangular shaped cells, which are less numerous (i.e. parietal cells, identified with independent staining with anti-intrinsic factor, not shown), in zone II) per condition. Mean ± SD from 3 independent experiments; ****p < 0.0001, Welch’s test, infected (H. pylori SS1) vs non-infected. Optical slices were taken every 200-nm interval along the z-axis covering the whole depth of the tissue, and quantification was performed on 2D images generated from 3D volume rendering (see details in supplementary material). (D) Quantification of mtDNA by qPCR in the gene cytochrome c oxidase 1. Mean ± SD from 3 independent experiments; *p < 0.05; **p < 0.01. (E) Mutations spectra determined in the mtDNA D-loop region from gastric mucosa of infected and non-infected mice after 6 and 12 months. MtDNA mutations were analysed between nucleotides 41 and 843 in the mtDNA D-loop sequence. Seventy-five percent of H. pylori-induced mutations were substitution base pairs, half of them correspond to AT- > GC transitions.

