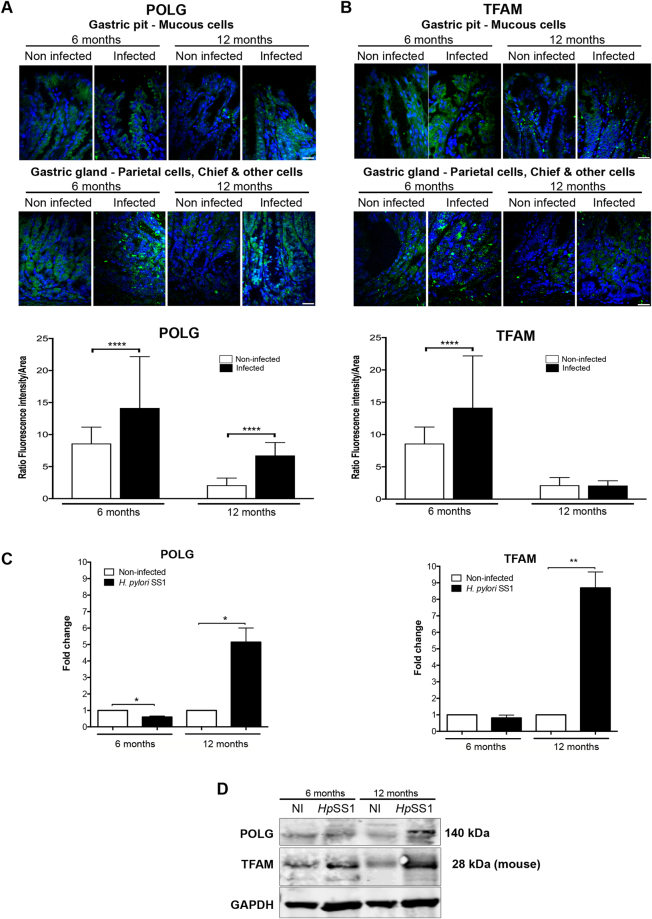
Figure 2.
H. pylori induces POLG and TFAM in INS-GAS mice. (A) POLG and (B) TFAM immunofluorescence intensity (upper panels) and quantification (lower panels) on gastric tissue section of H. pylori SS1-infected INS-GAS mice. 1600 cells were assessed per condition, as described in Fig. 1C. Mean ± SD from 3 independent experiments; ****p < 0.0001, Welch’s test, infected (H. pylori SS1) vs non-infected. (C) Expression of genes coding for PolG and Tfam quantified by RT-qPCR from RNA isolated from the gastric mucosa of infected and non-infected mice at each time-point. Values represent the mean ± SD of three independent measurements for each group of mice. Infected mice compared to non-infected; *p < 0.05; **p < 0.01. (D) Western blot on total gastric proteins. The 28 kDa isoform of TFAM (mouse) is prevalent. Samples were derived from the same experiment and the gel and blots were processed in parallel. The blot was then sliced in three horizontal sections to allow multiple immunolabelings with the same membrane. Sections were alternatively labeled with anti-POLG, anti-TFAM, or anti-GAPDH. The corresponding uncropped gel/blots are shown in Supplementary Figure S7B.

