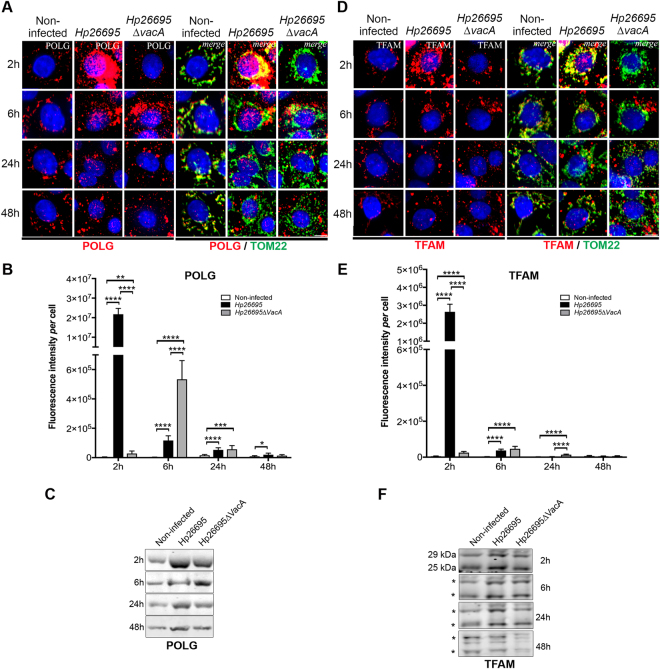
Figure 4.
VacA-dependent and VacA-independent increase of POLG and TFAM early upon H. pylori infection. AGS cells co-cultured with H. pylori 26695 or 26695∆vacA. (A) POLG and (D) TFAM immunofluorescence (red, left panels); merge with TOM22 immunostaining (green) and nuclei (Hoechst, blue) (right panels). Scale bar: 10µm. (B) POLG and (E) TFAM quantification of immunofluorescence intensity (n = 30 cells/condition (and n = 50 non-infected cells) from three independent experiments mean ± SD, Welch’s test, **p < 0.01; ***p < 0.001; ****p < 0.0001. WB of (C) POLG and (F) TFAM (human 29 kDa and 25 kDa isoforms, position indicated with a star). Samples were derived from the same experiment and the gels and blots were processed in parallel (one gel for 2 h and 6 h, one gel for 24 h and 48 h). Each blot was then sliced in horizontal sections to allow multiple immunolabelings with the same membrane. Sections were alternatively labeled with anti-POLG and anti-TFAM (other labelings performed with the remaining portions of the membrane are not shown). The corresponding uncropped gels/blots are shown in Supplementary Figure S7C. SYPRO Ruby blot staining used as loading control (total protein staining is used as alternative to overcome single housekeeping protein variations) is shown in Supplementary Figure S7C (entire gel staining). Data from 3 independent experiments.

