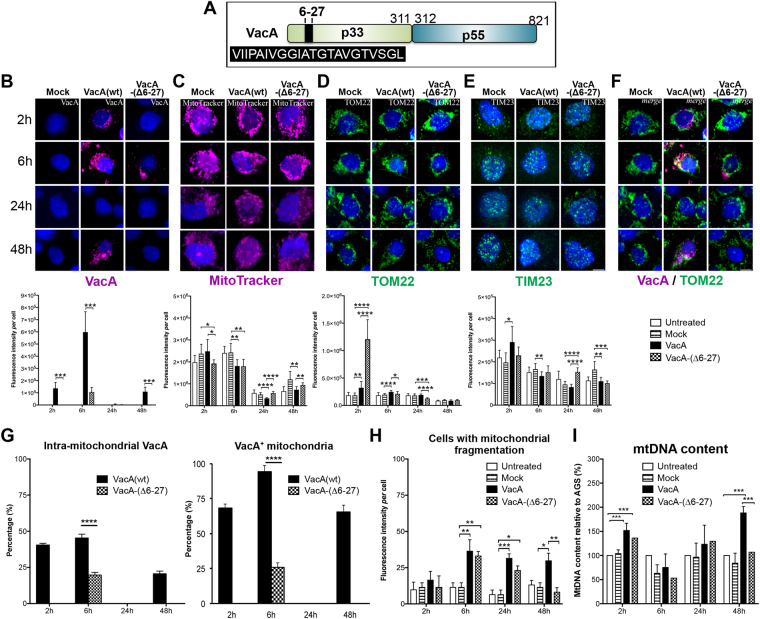
Figure 5.
Isolated VacA affects mitochondria and mtDNA content. AGS cells incubated with acid-activated VacA(wt) and VacA-(∆6-27)35. (A) Schematic representation of VacA domains. The black box indicates the aminoacid composition of the N-terminal hydrophobic region deleted in VacA-(∆6-27). (B) VacA (purple), (C) mitochondria labelling by MitoTracker (purple), (D) TOM22 (green), (E) TIM23 (green) immunostaining, (F) VacA and TOM22 merge (right panel). Nuclei (Hoechst, blue). Scale bar: 10 µm. Quantification of immunofluorescence intensity below each panel (n = 30 cells/condition from three independent experiments (panels B and D n = 6), mean ± SD, Welch’s test). (G) Percentage of intra-mitochondrial VacA(wt) and VacA-(∆6-27) (VacA+TOM22+/total VacA labelling, left panel) and mitochondria that co-localize with VacA (VacA+TOM22+/total TOM22 labelling, right panel), n = 6 experiments, Welch’s test. (H) Percentage of cells with mitochondria fragmentation (n = 60 cells/condition, from 3 independent experiments, 2-tailed Fisher’s exact test). (I) Quantification of mtDNA by qPCR; mean ± SD from n = 3 experiments. Untreated: AGS cells; Mock: AGS cells incubated with the VacA activation buffer as control. Values of untreated cells in panels C-E are the same as in Fig. 3F since these experiments and the relative acquisitions were done at the same time. VacA or VacA-(-∆6-27) versus Mock (in panels B and G: VacA versus VacA-(∆6-27)); *p < 0.05; **p < 0.01; ***p < 0.001; ****p < 0.0001.

