Fig. 2.
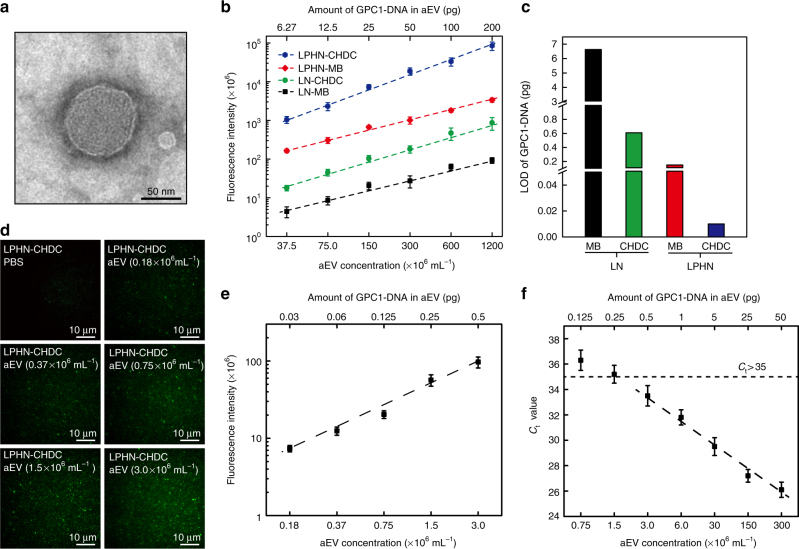
Artificial EV works as a standard. a Transmission electron microscopy (TEM) micrograph of artificial EV (aEV). b Calibration curves for fluorescence intensity of GPC1 ssDNA oligo (GPC1-DNA) expression in aEVs using lipoplex nanoparticles containing molecular beacon (LN–MB), lipoplex nanoparticles containing catalyzed hairpin DNA circuit (LN–CHDC), lipid-polymer hybrid nanoparticles containing molecular beacon (LPHN–MB), and lipid-polymer hybrid nanoparticles containing catalyzed hairpin DNA circuit (LPHN–CHDC) individually vs. aEV concentration (37.5, 75.0, 150, 300, 600, and 1200 × 106 mL−1) (bottom x-axis) or amount of GPC1-DNA in aEV (6.27, 12.5, 25.0, 50.0, 100, and 200 pg) (upper x-axis). c Linear scale comparison of limit of detection (LOD) among LN–MB, LN–CHDC, LPHN–MB, and LPHN–CHDC. d Representative TIRF images of GPC1-DNA expression in varied extremely low concentrations of aEVs (0.18, 0.37, 0.75, 1.5, and 3.0 × 10⁶ mL−1) by using LPHN–CHDC. e Calibration curve for fluorescence intensity of GPC1-DNA expression in aEVs using LPHN–CHDC vs. low concentration of aEV (0.18, 0.37, 0.75, 1.5, and 3.0 × 10⁶ mL−1) (bottom x-axis) or low amount of GPC1-DNA in aEV (0.03, 0.06, 0.125, 0.25, and 0.5 pg) (upper x-axis). f Standard curve of GPC1-DNA expressed in aEVs as the DNA quantity per reaction tube of RT-PCR from 0.125 to 50 pg by serial dilutions, respectively. Data represent mean ± s.d., n = 3, three technical replicates

